微服务调用链路追踪 |
您所在的位置:网站首页 › 微服务 链路追踪 › 微服务调用链路追踪 |
微服务调用链路追踪
|
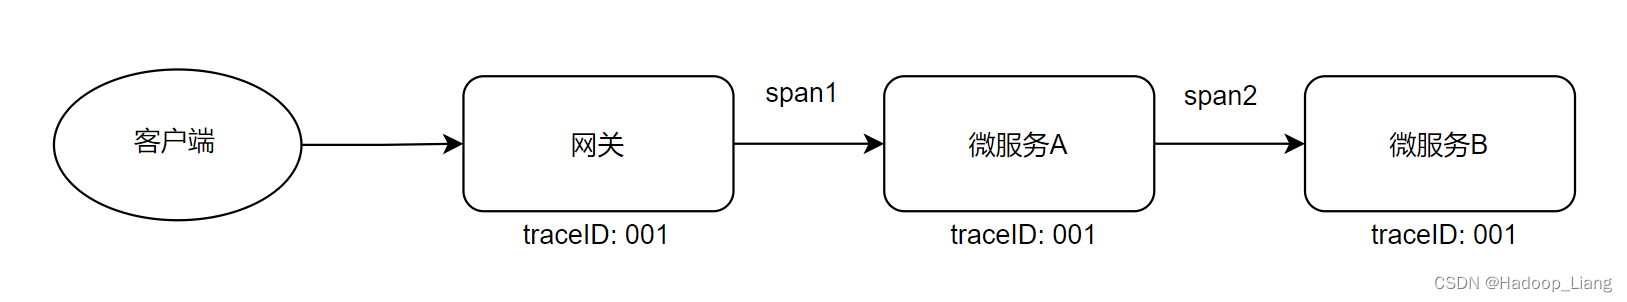
目录 概述 环境说明 步骤 sleuth zipkin Zipkin 服务端 Zipkin 客户端 链路数据持久化 RabbitMQ请求 1. 安装RabbitMQ 2. 启动zipkin服务端,配置从rabbit中拉取消息 3.修改zipkin客户端,将消息以rabbit的形式发送到mq服务端 概述 本文介绍微服务调用链路追踪,涉及技术有:sleuth和zipkin。sleuth负责追踪调用链路数据,zipkin负责调用链路数据可视化展现。 本文的操作是在 服务网关实践 的基础上进行。 环境说明jdk1.8 maven3.6.3 mysql8 spring cloud2021.0.8 spring boot2.7.12 idea2022 步骤 sleuth一个调用链路如图所示:
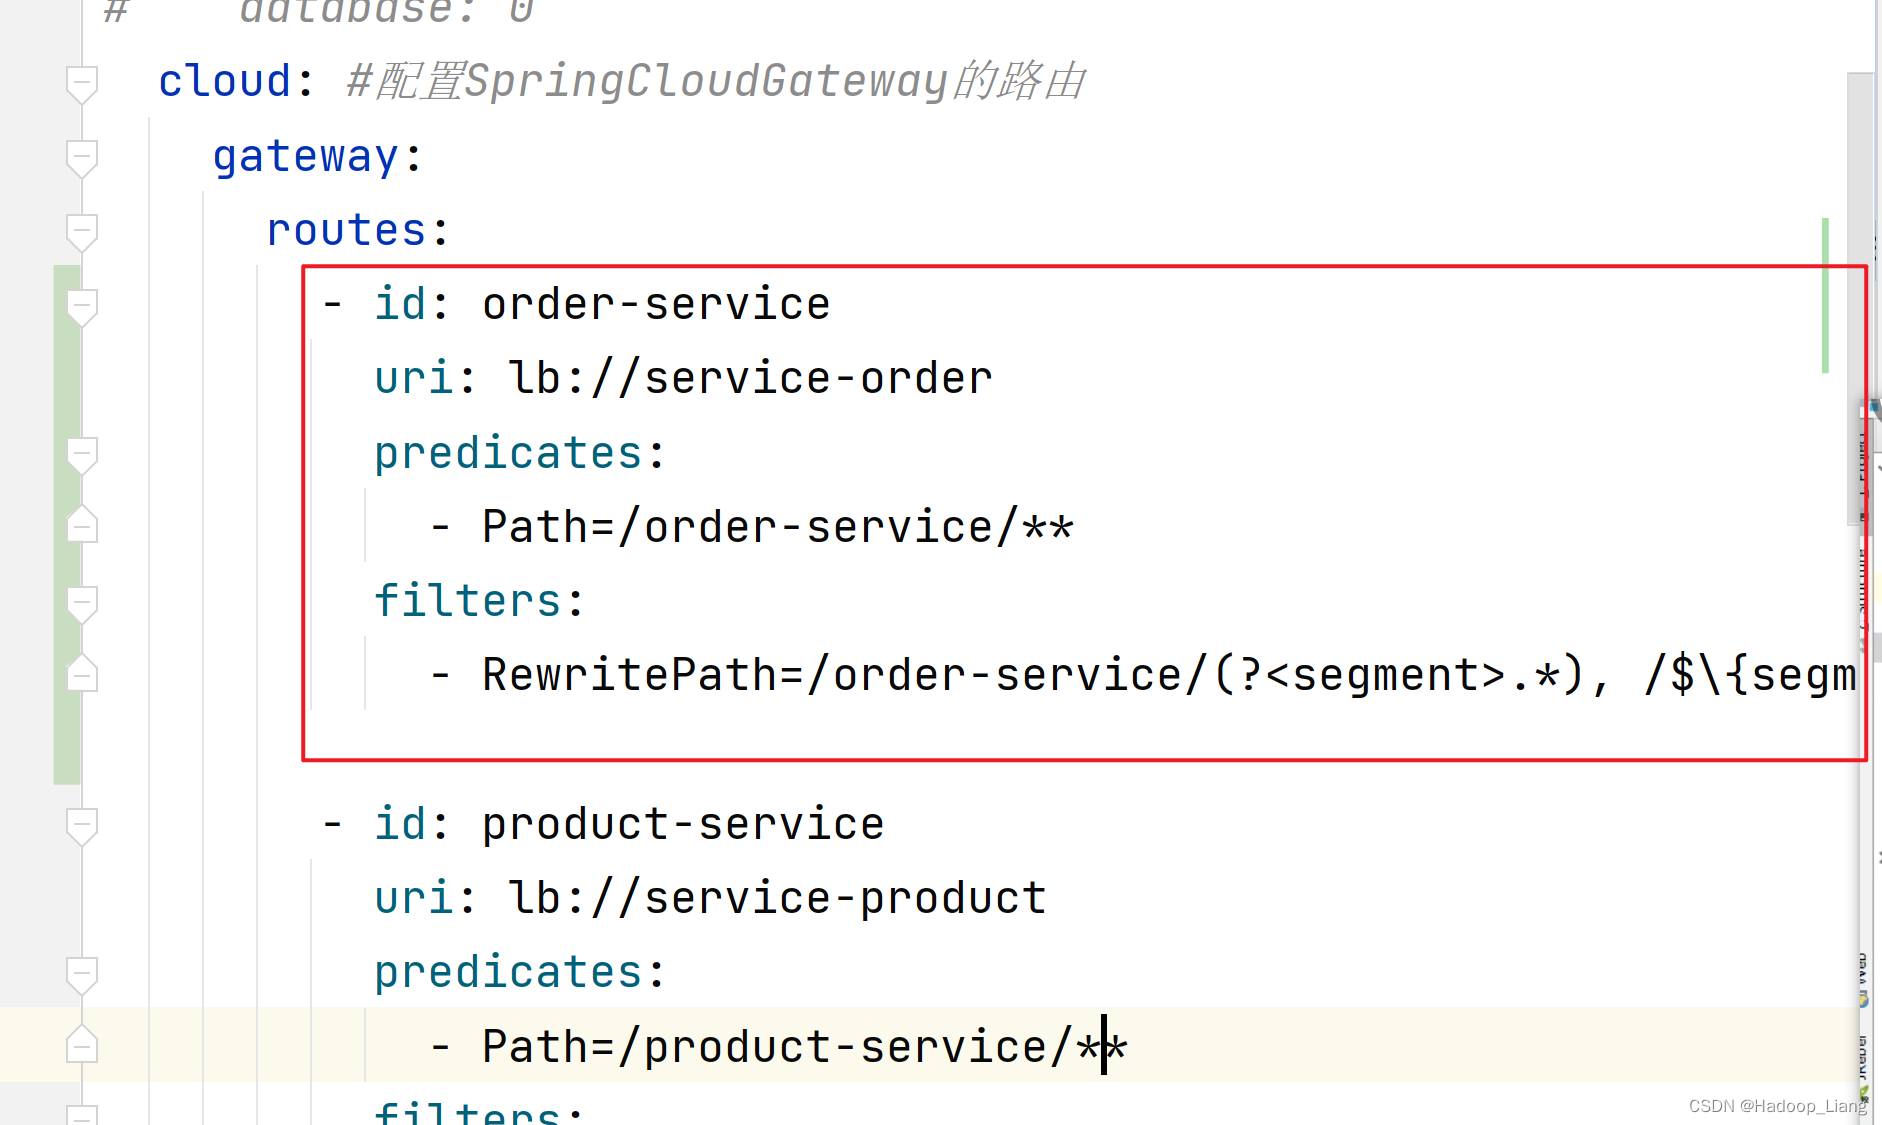
sleuth核心概念:trace和span trace:整个调用链路 span:每个最小工作单元,代表一次远程微服务调用 操作 修改api_gateway_server网关服务 为了方便测试,取消LoginFilter功能,注释LonginFilter上方的@Component注解 //@Component public class LoginFilter implements GlobalFilter, Ordered {application.yml添加如下order-service配置 - id: order-service uri: lb://service-order predicates: - Path=/order-service/** filters: - RewritePath=/order-service/(?.*), /$\{segment}
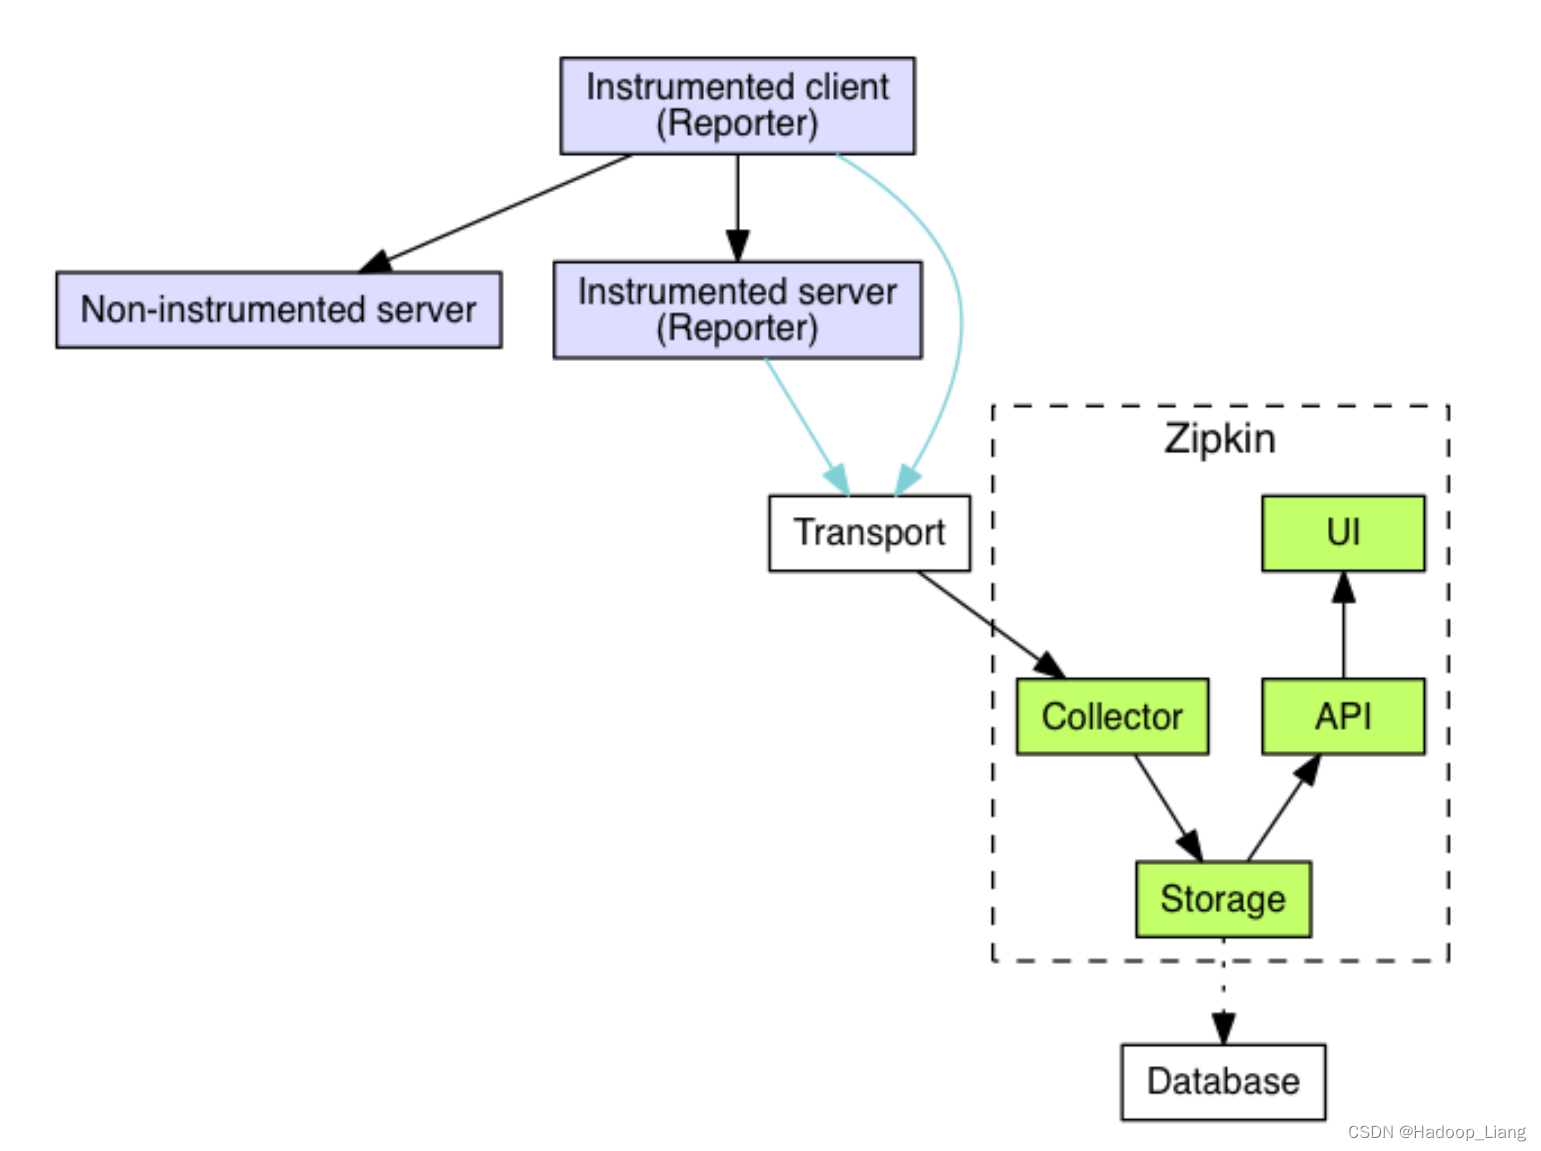
启动eureka,product,order,gateway服务 测试访问服务 http://localhost:8080/product-service/product/1 响应 {"id":1,"productName":"访问的服务地址:192.168.43.3:9001","status":1,"price":3000.00,"productDesc":"abc","caption":"haha","inventory":100} http://localhost:8080/order-service/order/buy/1 响应 {"id":1,"productName":"访问的服务地址:192.168.43.3:9001","status":1,"price":3000.00,"productDesc":"abc","caption":"haha","inventory":100} 确保服务均能正常访问 接下来要记录 网关、订单和商品的日志,在需要记录日志的服务中添加sleuth依赖,并配置日志级别 在网关、订单和商品服务分别添加如下依赖: org.springframework.cloud spring-cloud-starter-sleuth在网关、订单和商品服务分别添加如下配置: logging: level: root: info org.springframework.web.servlet.DispatcherServlet: DEBUG org.springframework.cloud.sleuth: DEBUG重启网关、订单和商品服务 访问 http://localhost:8080/order-service/order/buy/1 网关控制台日志 2023-09-19 11:31:38.286 DEBUG [api-gateway-server,,] 11388 --- [ctor-http-nio-8] o.s.c.s.instrument.web.TraceWebFilter : Received a request to uri [/order-service/order/buy/1] 2023-09-19 11:31:38.287 DEBUG [api-gateway-server,,] 11388 --- [ctor-http-nio-8] o.s.c.s.instrument.web.TraceWebFilter : Handled receive of span RealSpan(b509a00af729a159/b509a00af729a159) 2023-09-19 11:31:38.290 DEBUG [api-gateway-server,,] 11388 --- [ctor-http-nio-8] ientBeanPostProcessor$TracingDoOnRequest : Handled send of the netty client span [RealSpan(b509a00af729a159/33785169a50ab934)] with parent [b509a00af729a159/b509a00af729a159] 2023-09-19 11:31:38.304 DEBUG [api-gateway-server,,] 11388 --- [ctor-http-nio-8] o.s.c.s.instrument.web.TraceWebFilter : Handled send of RealSpan(b509a00af729a159/b509a00af729a159) 2023-09-19 11:31:38.304 DEBUG [api-gateway-server,,] 11388 --- [ctor-http-nio-8] PostProcessor$AbstractTracingDoOnHandler : Handle receive of the netty client span [RealSpan(b509a00af729a159/33785169a50ab934)] 2023-09-19 11:31:39.307 DEBUG [api-gateway-server,,] 11388 --- [ctor-http-nio-3] o.s.c.s.instrument.web.TraceWebFilter : Received a request to uri [/registry/machine] 2023-09-19 11:31:39.307 DEBUG [api-gateway-server,,] 11388 --- [ctor-http-nio-3] o.s.c.s.instrument.web.TraceWebFilter : Handled receive of span RealSpan(295a9df15244c974/295a9df15244c974) 2023-09-19 11:31:39.309 DEBUG [api-gateway-server,295a9df15244c974,295a9df15244c974] 11388 --- [ctor-http-nio-3] o.s.c.s.instrument.web.TraceWebFilter : Adding a class tag with value [ResourceWebHandler] to a span RealSpan(295a9df15244c974/295a9df15244c974) 2023-09-19 11:31:39.309 DEBUG [api-gateway-server,295a9df15244c974,295a9df15244c974] 11388 --- [ctor-http-nio-3] o.s.c.s.instrument.web.TraceWebFilter : Handled send of RealSpan(295a9df15244c974/295a9df15244c974)关注span信息 订单控制台日志 2023-09-19 11:31:38.291 DEBUG [service-order,,] 12160 --- [nio-9002-exec-3] o.s.c.s.i.web.tomcat.TraceValve : Created a server receive span [RealSpan(b509a00af729a159/33785169a50ab934)] 2023-09-19 11:31:38.291 DEBUG [service-order,b509a00af729a159,33785169a50ab934] 12160 --- [nio-9002-exec-3] o.s.web.servlet.DispatcherServlet : GET "/order/buy/1", parameters={} 2023-09-19 11:31:38.294 DEBUG [service-order,,] 12160 --- [derController-4] RetryableFeignBlockingLoadBalancerClient : Before send 2023-09-19 11:31:38.295 DEBUG [service-order,,] 12160 --- [derController-4] o.s.c.s.i.w.c.f.LazyTracingFeignClient : Sending a request via tracing feign client [org.springframework.cloud.sleuth.instrument.web.client.feign.TracingFeignClient@7f92dc34] and the delegate [feign.Client$Default@547ecdf2] 2023-09-19 11:31:38.295 DEBUG [service-order,,] 12160 --- [derController-4] o.s.c.s.i.w.c.feign.TracingFeignClient : Handled send of NoopSpan(52272d7b4d72b7ed/52272d7b4d72b7ed) 2023-09-19 11:31:38.301 DEBUG [service-order,,] 12160 --- [derController-4] o.s.c.s.i.w.c.feign.TracingFeignClient : Handled receive of NoopSpan(52272d7b4d72b7ed/52272d7b4d72b7ed) 2023-09-19 11:31:38.301 DEBUG [service-order,,] 12160 --- [derController-4] RetryableFeignBlockingLoadBalancerClient : After receive 2023-09-19 11:31:38.303 DEBUG [service-order,b509a00af729a159,33785169a50ab934] 12160 --- [nio-9002-exec-3] o.s.web.servlet.DispatcherServlet : Completed 200 OK 2023-09-19 11:31:38.303 DEBUG [service-order,,] 12160 --- [nio-9002-exec-3] o.s.c.s.i.web.tomcat.TraceValve : Handled send of span [RealSpan(b509a00af729a159/33785169a50ab934)]商品控制台日志 2023-09-19 11:31:38.296 DEBUG [service-product,,] 11896 --- [nio-9001-exec-6] o.s.c.s.i.web.tomcat.TraceValve : Created a server receive span [NoopSpan(52272d7b4d72b7ed/52272d7b4d72b7ed)] 2023-09-19 11:31:38.296 DEBUG [service-product,52272d7b4d72b7ed,52272d7b4d72b7ed] 11896 --- [nio-9001-exec-6] o.s.web.servlet.DispatcherServlet : GET "/product/1", parameters={} Hibernate: select product0_.id as id1_0_0_, product0_.caption as caption2_0_0_, product0_.inventory as inventor3_0_0_, product0_.price as price4_0_0_, product0_.product_desc as product_5_0_0_, product0_.product_name as product_6_0_0_, product0_.status as status7_0_0_ from tb_product product0_ where product0_.id=? 2023-09-19 11:31:38.301 DEBUG [service-product,52272d7b4d72b7ed,52272d7b4d72b7ed] 11896 --- [nio-9001-exec-6] o.s.web.servlet.DispatcherServlet : Completed 200 OK 2023-09-19 11:31:38.301 DEBUG [service-product,,] 11896 --- [nio-9001-exec-6] o.s.c.s.i.web.tomcat.TraceValve : Handled send of span [NoopSpan(52272d7b4d72b7ed/52272d7b4d72b7ed)]sleuth能够进行调用链路追踪,但日志方式不方便直观看到调用关系,所以需要一个可视化工具zipkin,把调用过程进行可视化。 sleuth使用总结 网关配置,使用网关访问order服务 相关服务添加sleuth依赖及日志级别的配置 zipkinzipkin架构 Architecture · OpenZipkin
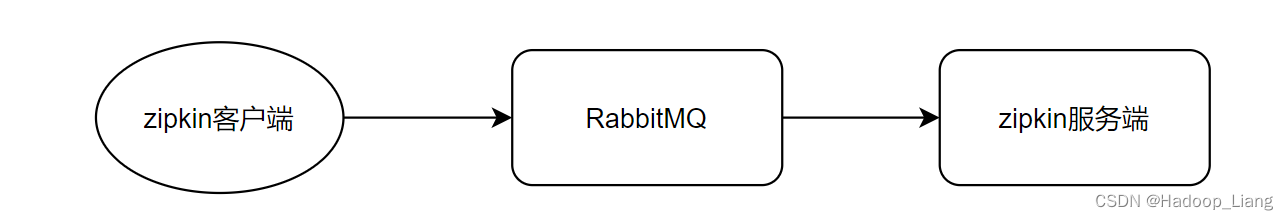
Zipkin 分为两端: Zipkin 服务端Zipkin 客户端,客户端就是各个微服务。客户端会配置服务端的 URL 地址,一旦发生服务间的调用的时候,会被配置在微服务里面的 Sleuth 的监听器监听,并生成相应的 Trace 和 Span 信息发送给服务端。 发送的方式主要有两种: HTTP 报文的方式消息总线的方式,如:RabbitMQ。不论哪种方式,我们都需要: 一个 Eureka 服务注册中心 一个 Zipkin 服务端。 多个微服务,微服务中配置Zipkin 客户端。 Zipkin 服务端下载zipkin server Quickstart · OpenZipkin 官网下载最新版本zipkin jar包后,cmd进入zipkin所在目录,使用java -jar命令执行 java -jar zipkin-server-2.24.3-exec.jar D:\soft\zipkin>java -jar zipkin-server-2.24.3-exec.jar Unable to get Charset 'cp65001' for property 'sun.stdout.encoding', using default GBK and continuing. oo oooo oooooo oooooooo oooooooooo oooooooooooo ooooooo ooooooo oooooo ooooooo oooooo ooooooo oooooo o o oooooo oooooo oo oo oooooo ooooooo oooo oooo ooooooo oooooo ooooo ooooo ooooooo oooooo oooooo oooooo ooooooo oooooooo oo oo oooooooo ooooooooooooo oo oo ooooooooooooo oooooooooooo oooooooooooo oooooooo oooooooo oooo oooo ________ ____ _ _____ _ _ |__ /_ _| _ \| |/ /_ _| \ | | / / | || |_) | ' / | || \| | / /_ | || __/| . \ | || |\ | |____|___|_| |_|\_\___|_| \_| :: version 2.24.3 :: commit 92554eb :: 2023-09-19 10:29:41.232 INFO [/] 4112 --- [oss-http-*:9411] c.l.a.s.Server : Serving HTTP at /0:0:0:0:0:0:0:0:9411 - http://127.0.0.1:9411/浏览器访问 localhost:9411
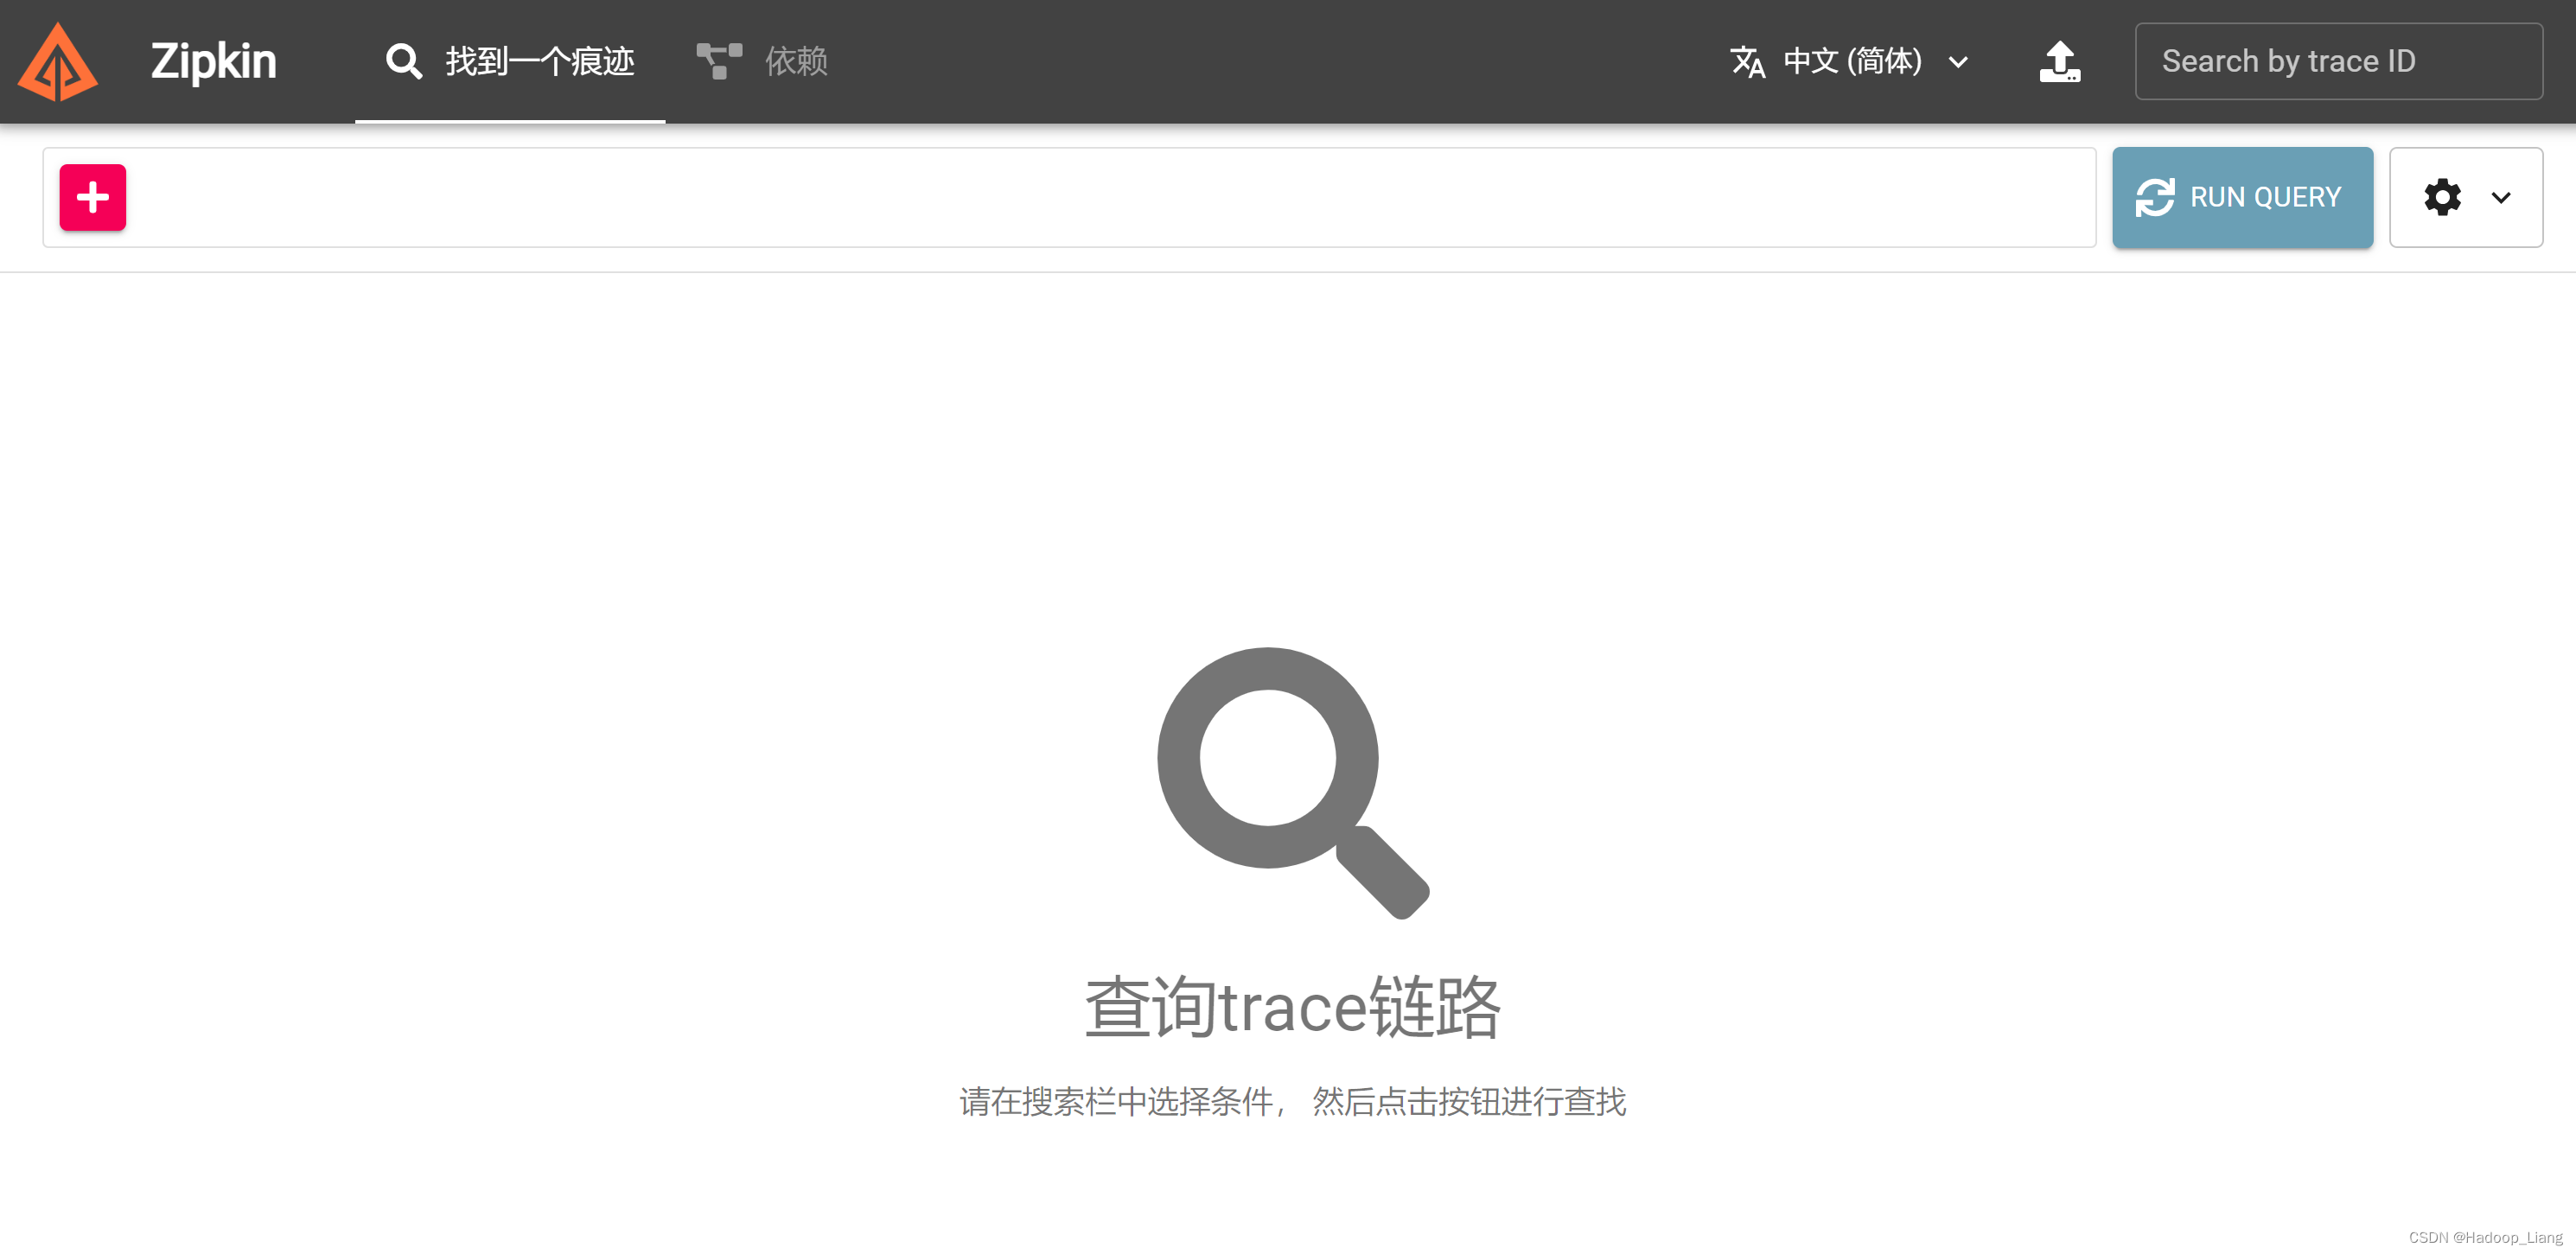
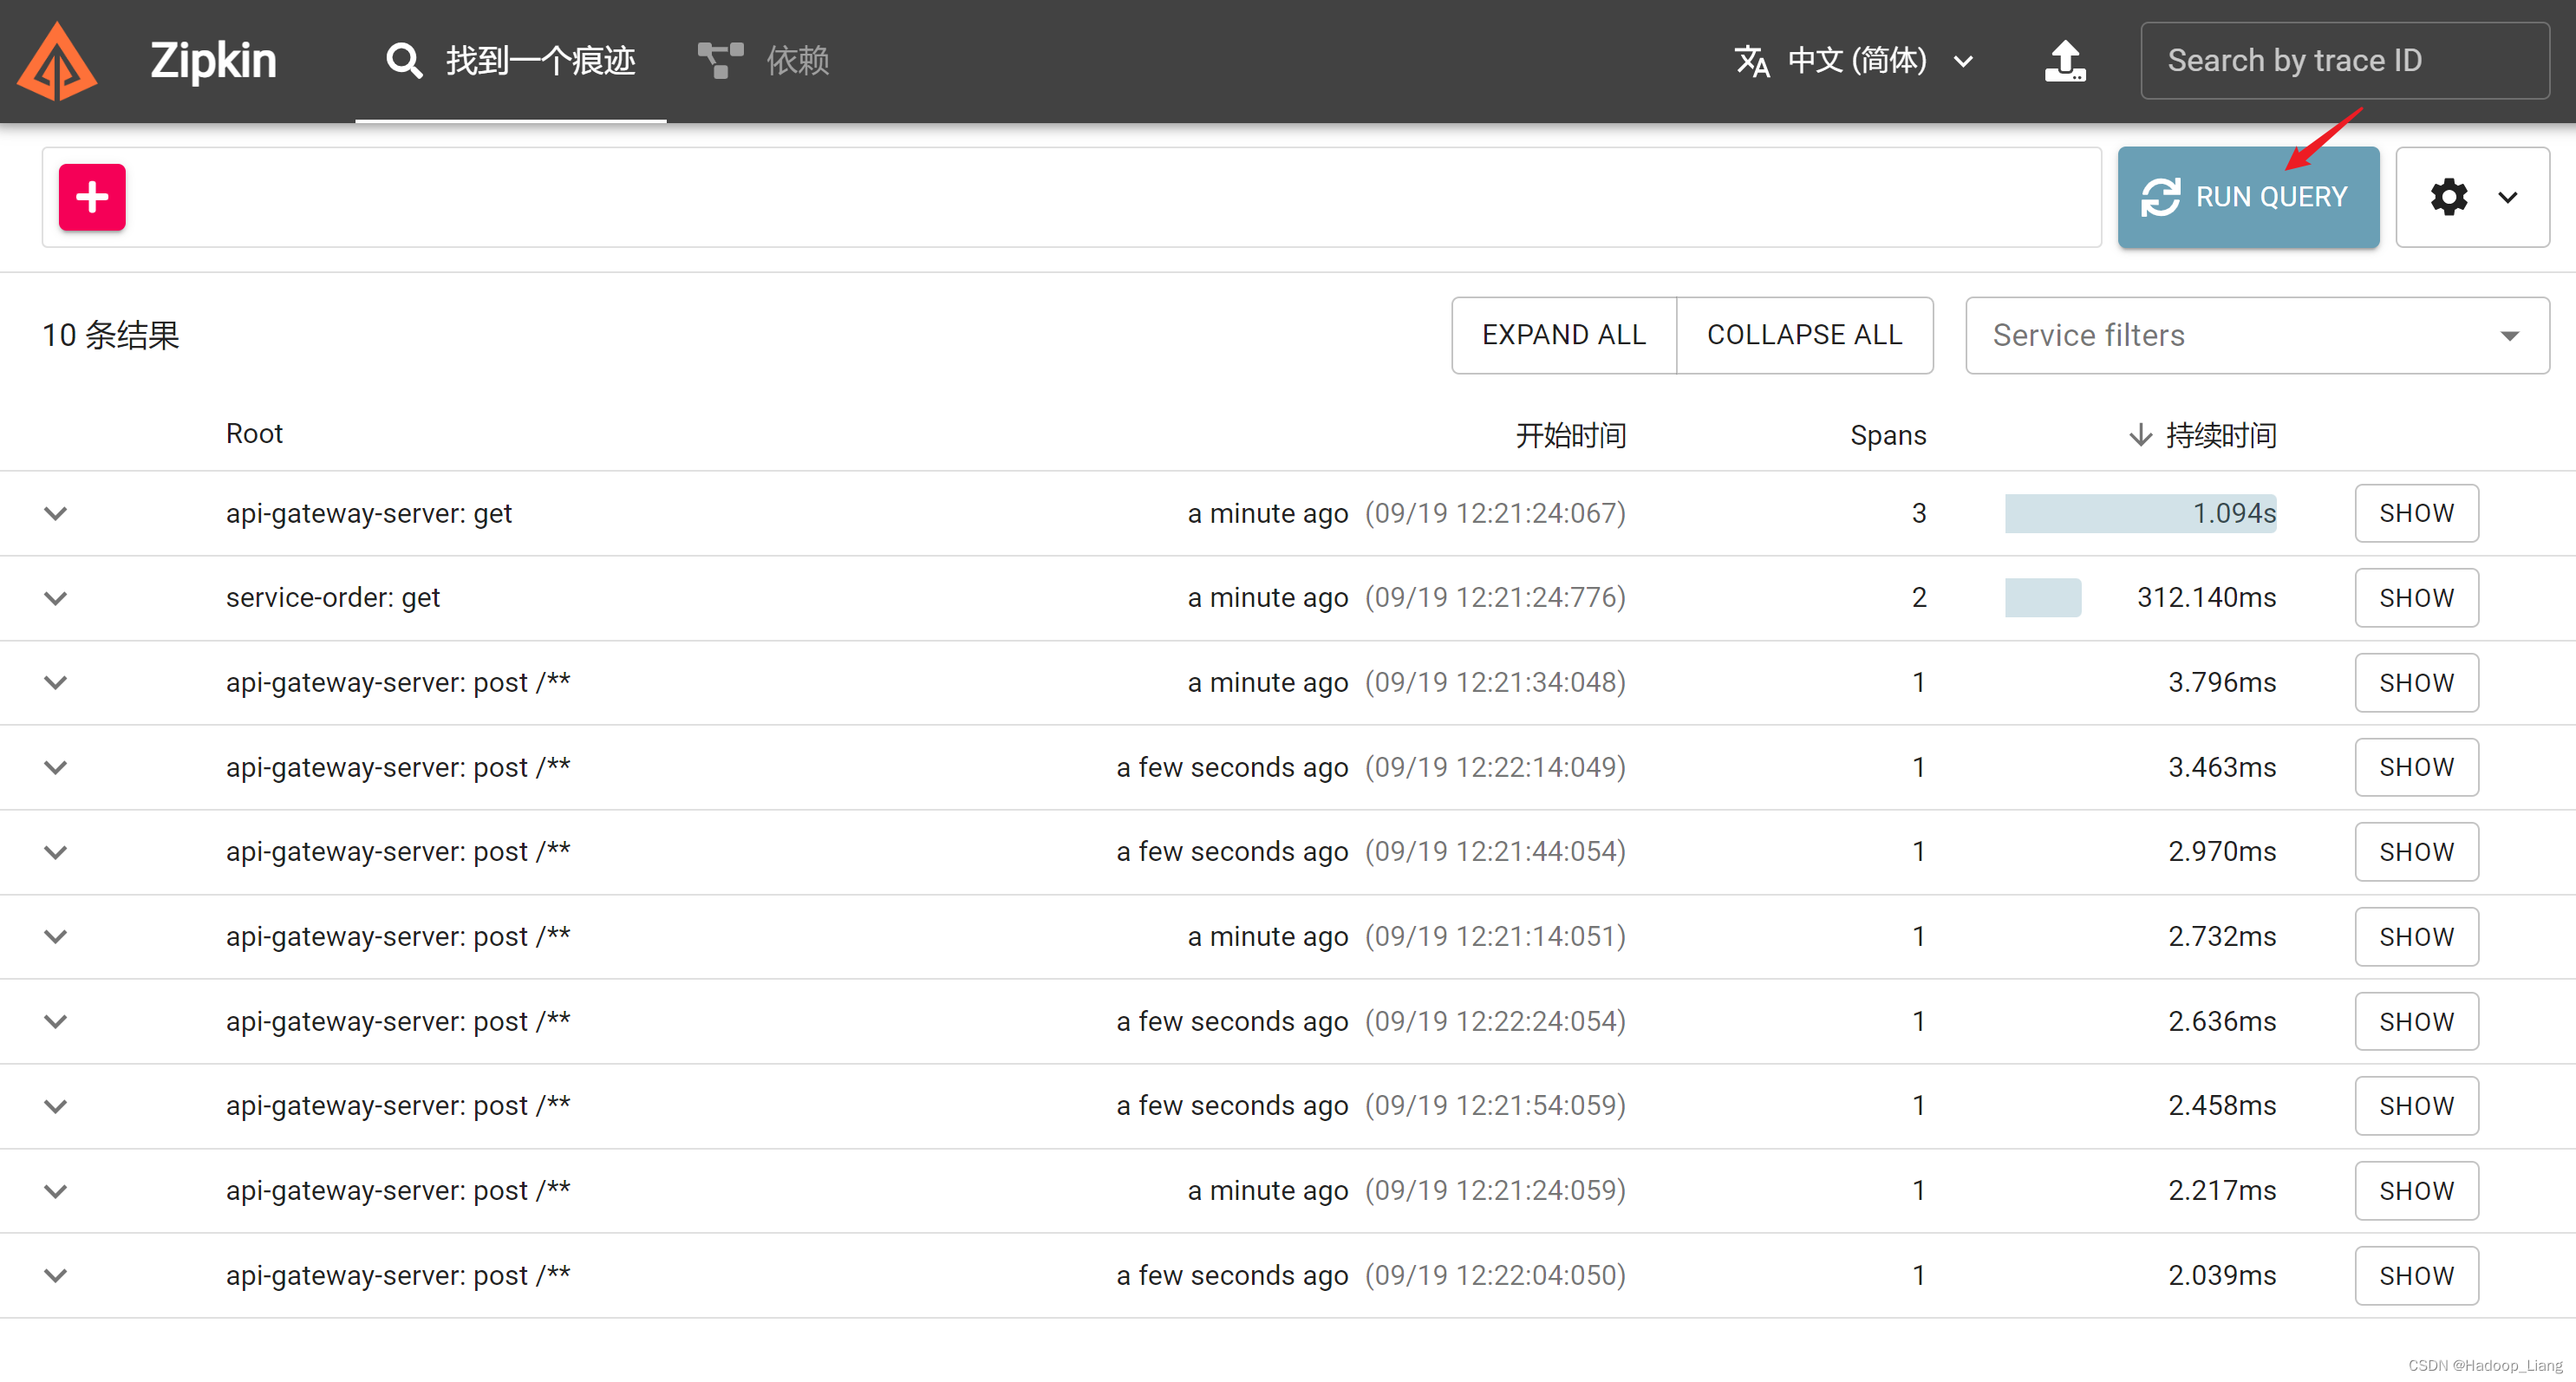
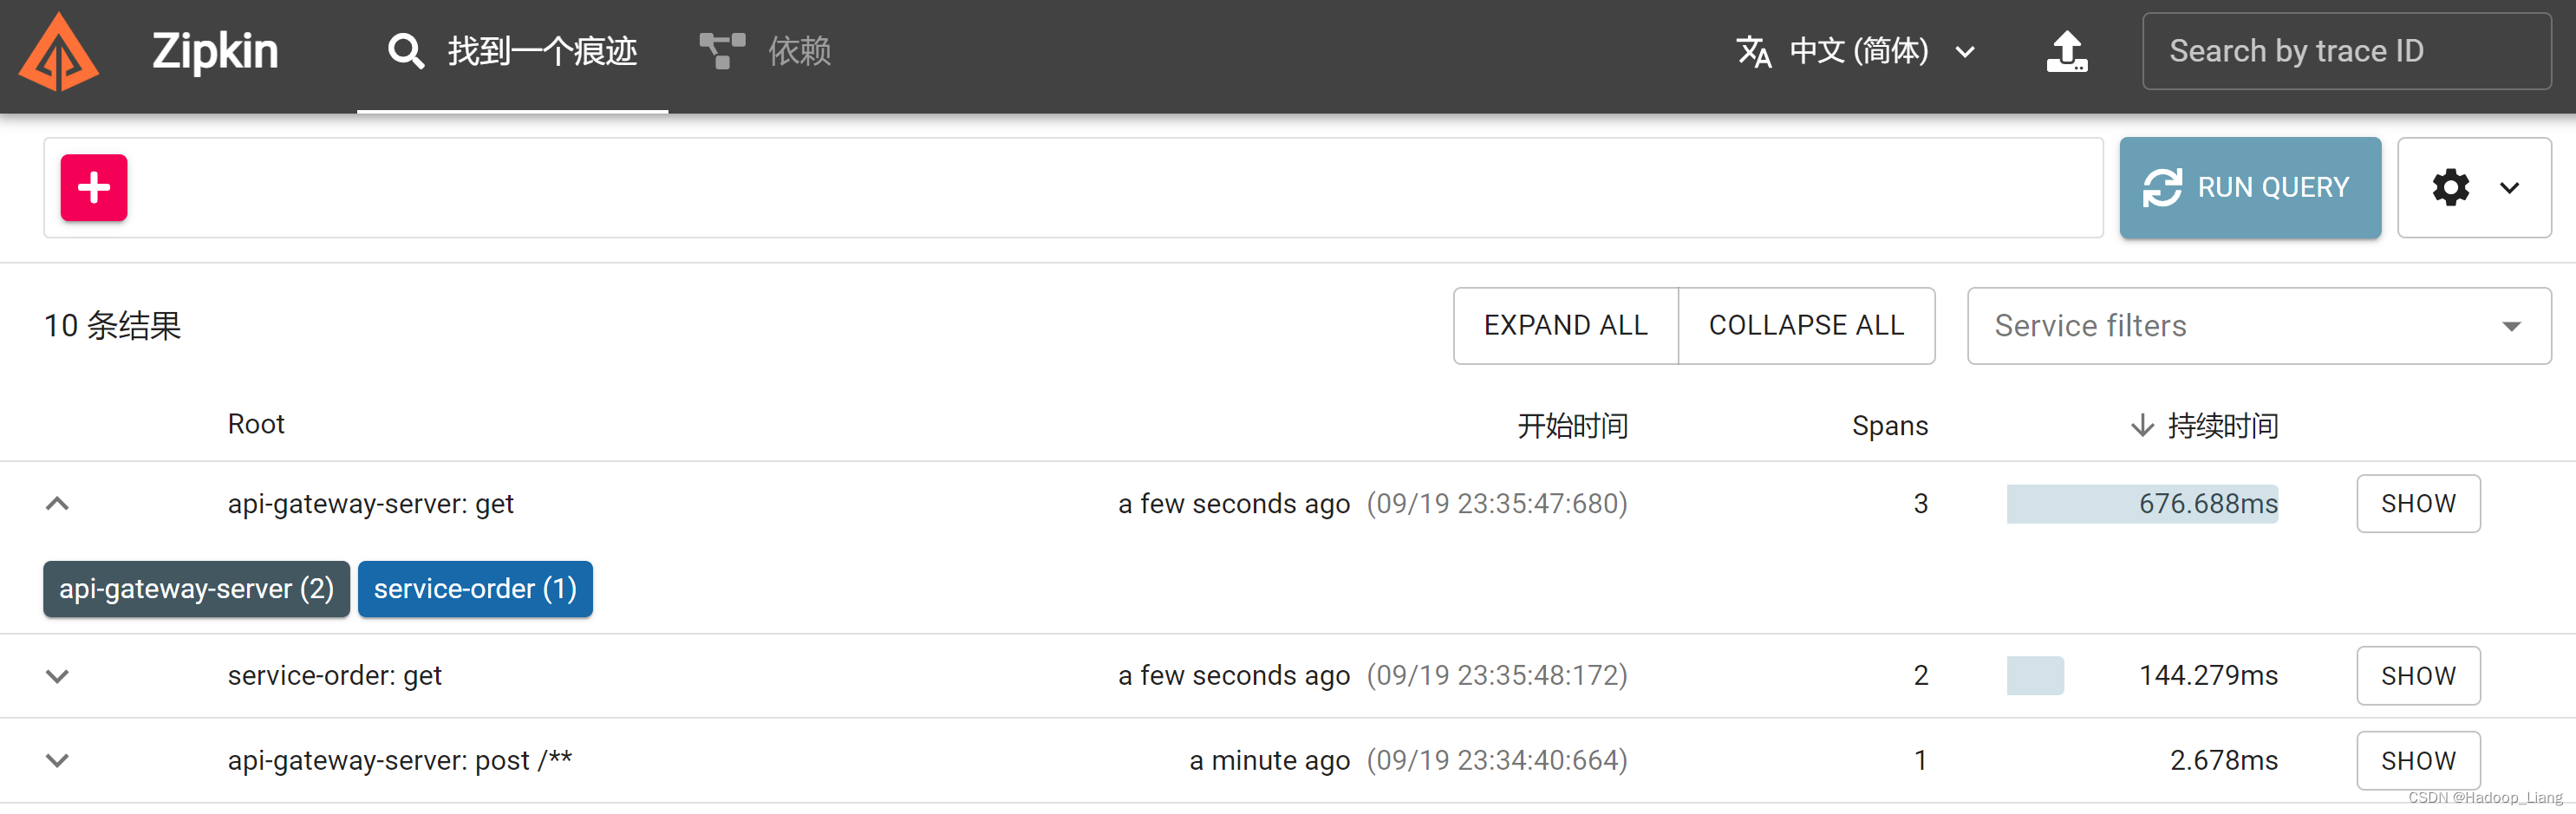
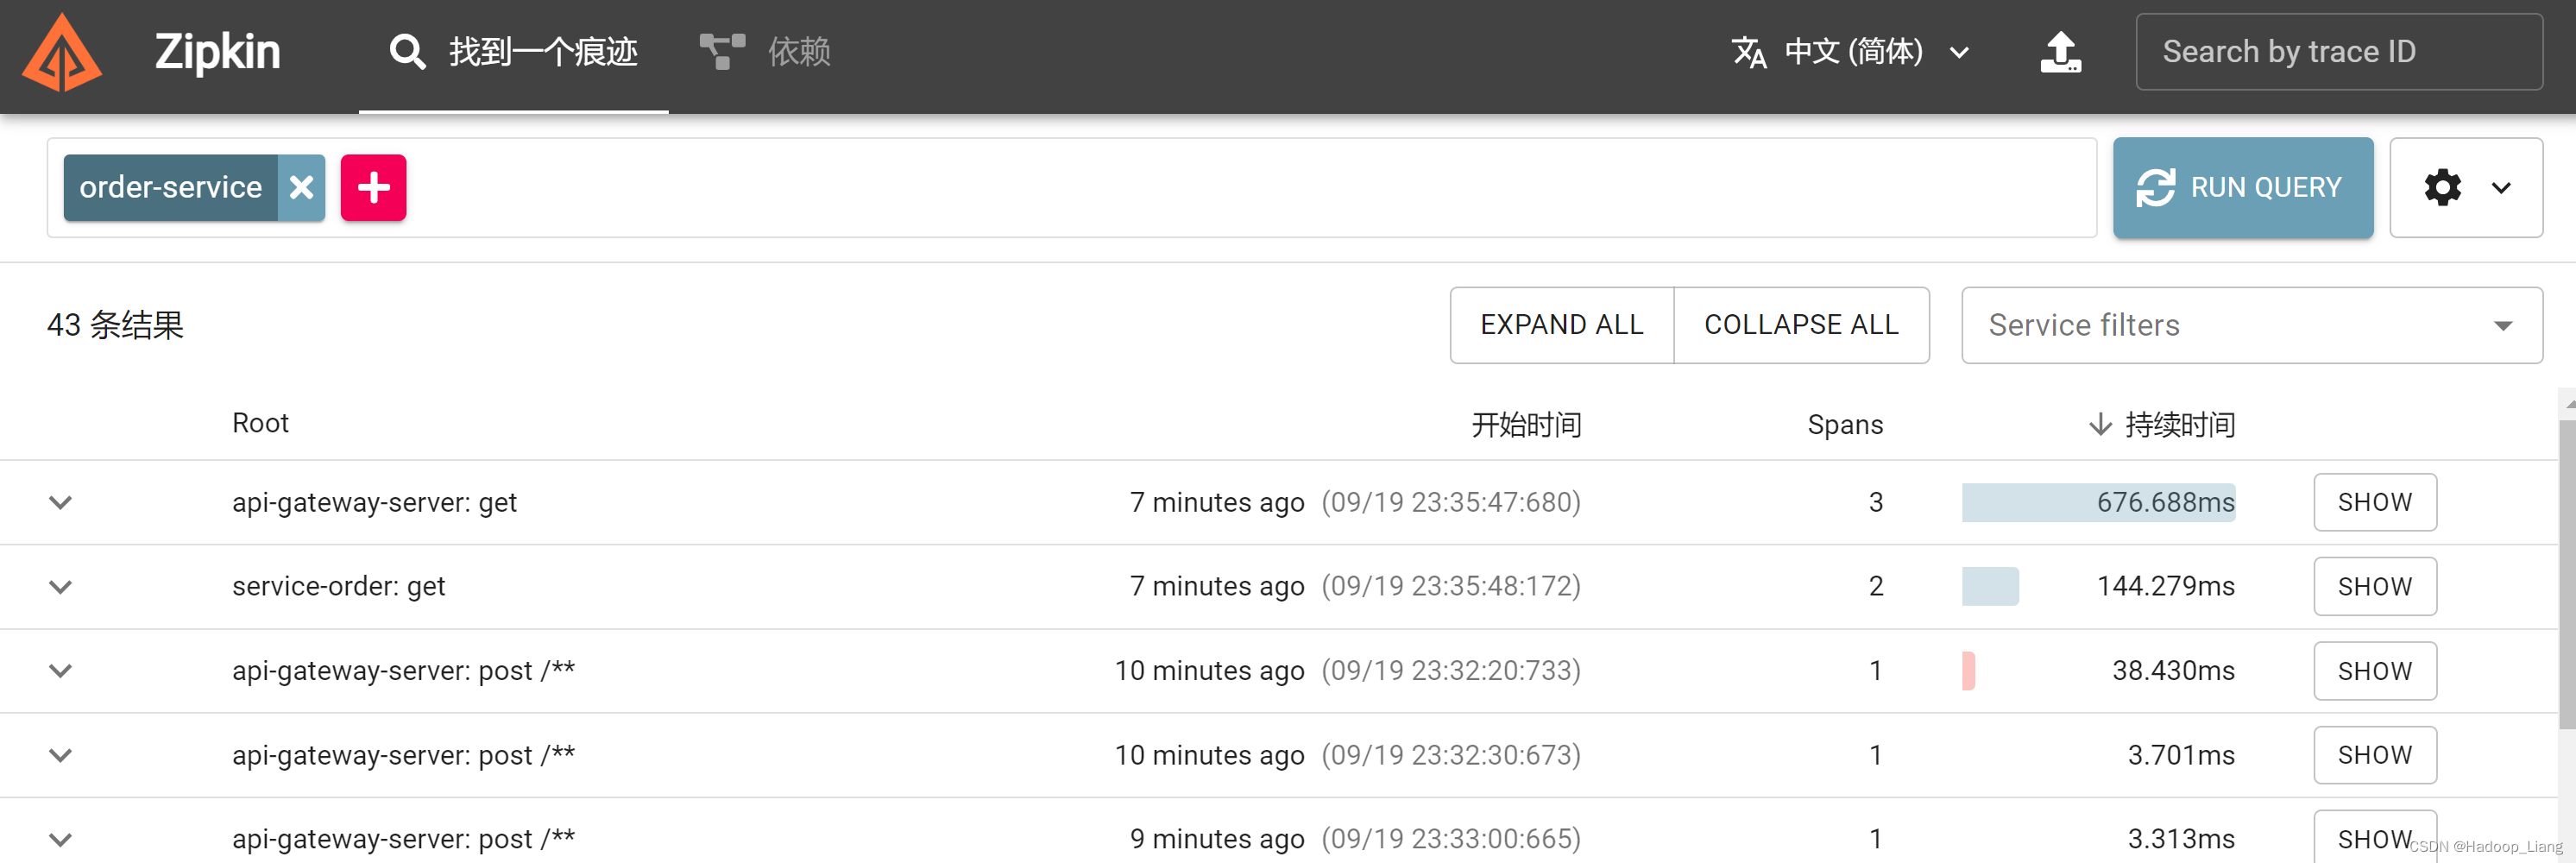
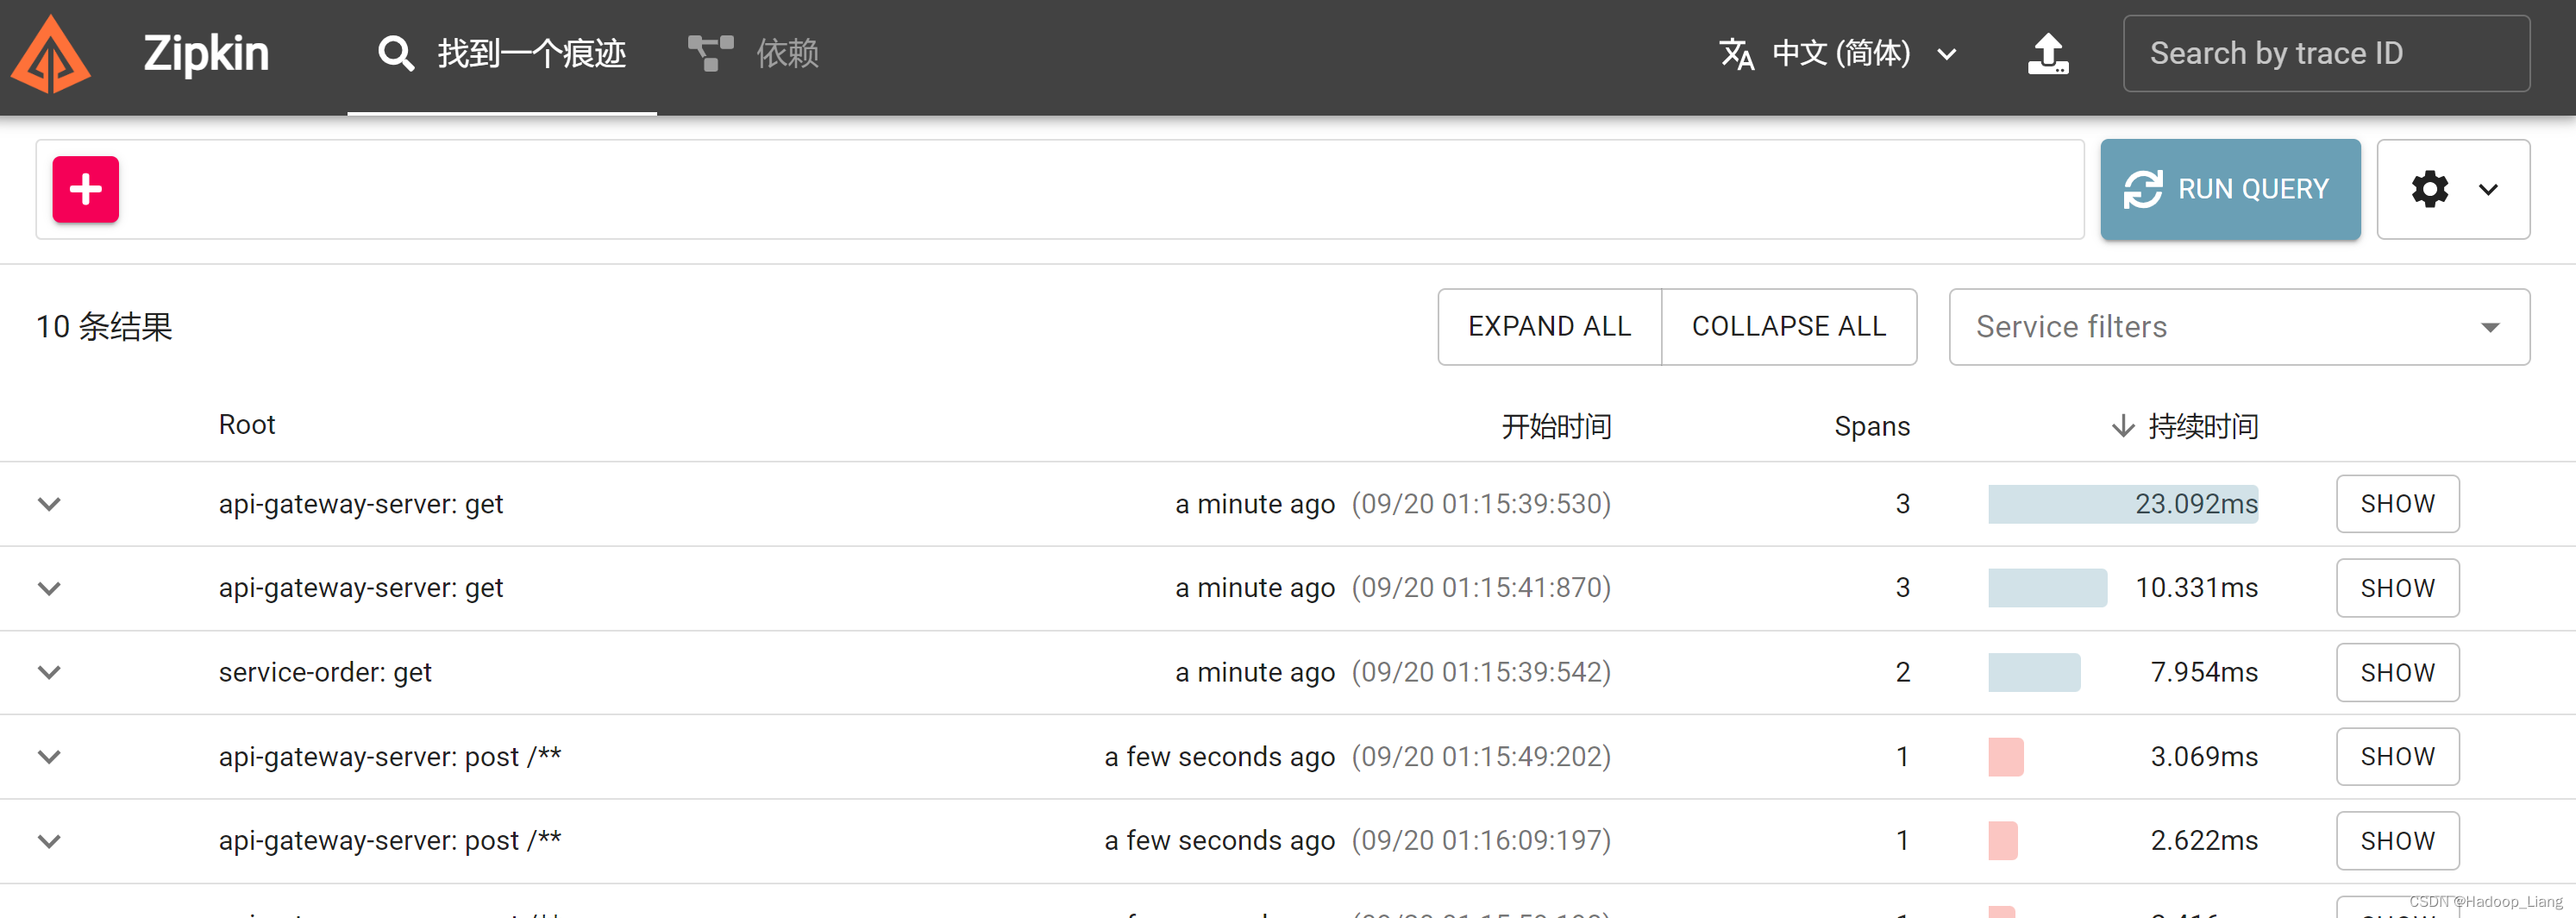
在需要链路追踪的服务(网关、订单、商品服务)添加zipkin依赖和配置 依赖 org.springframework.cloud spring-cloud-starter-zipkin 2.2.8.RELEASE配置 spring: zipkin: base-url: http://127.0.0.1:9411/ #zipkin server地址 sender: type: web #数据的传输方式,以http的方式向server端发送数据 sleuth: sampler: probability: 1 #采样比,日志的采样比例,默认0.1,测试环境设置为100%收集日志重启网关、订单、商品服务 测试 浏览器访问 http://localhost:8080/order-service/order/buy/1 响应 {"id":1,"productName":"访问的服务地址:192.168.43.3:9001","status":1,"price":3000.00,"productDesc":"abc","caption":"haha","inventory":100} 查看zipkin web页面,点击RUN QUERY查询
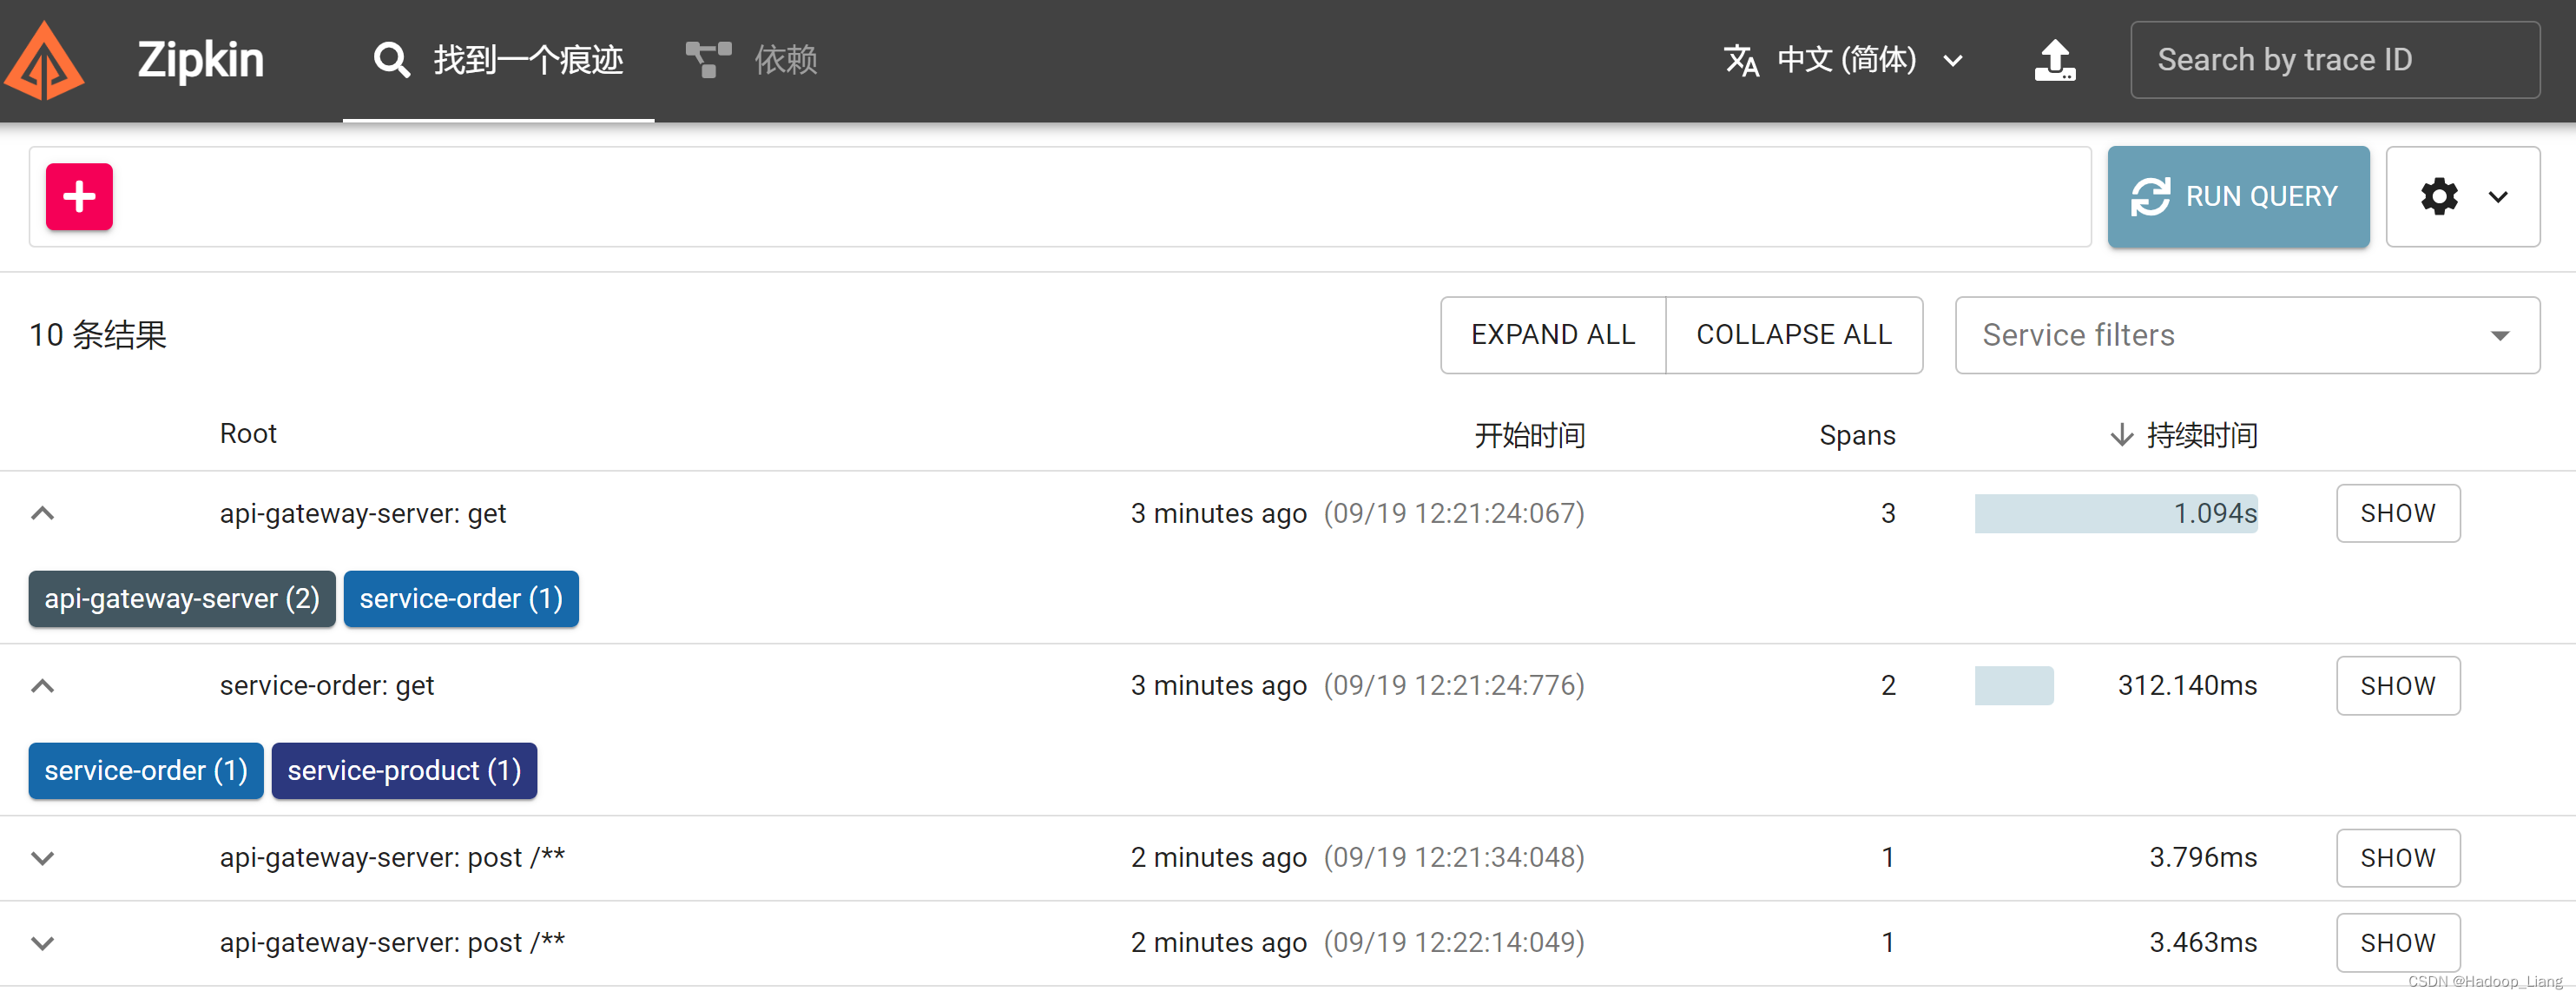
展开Root相关子项
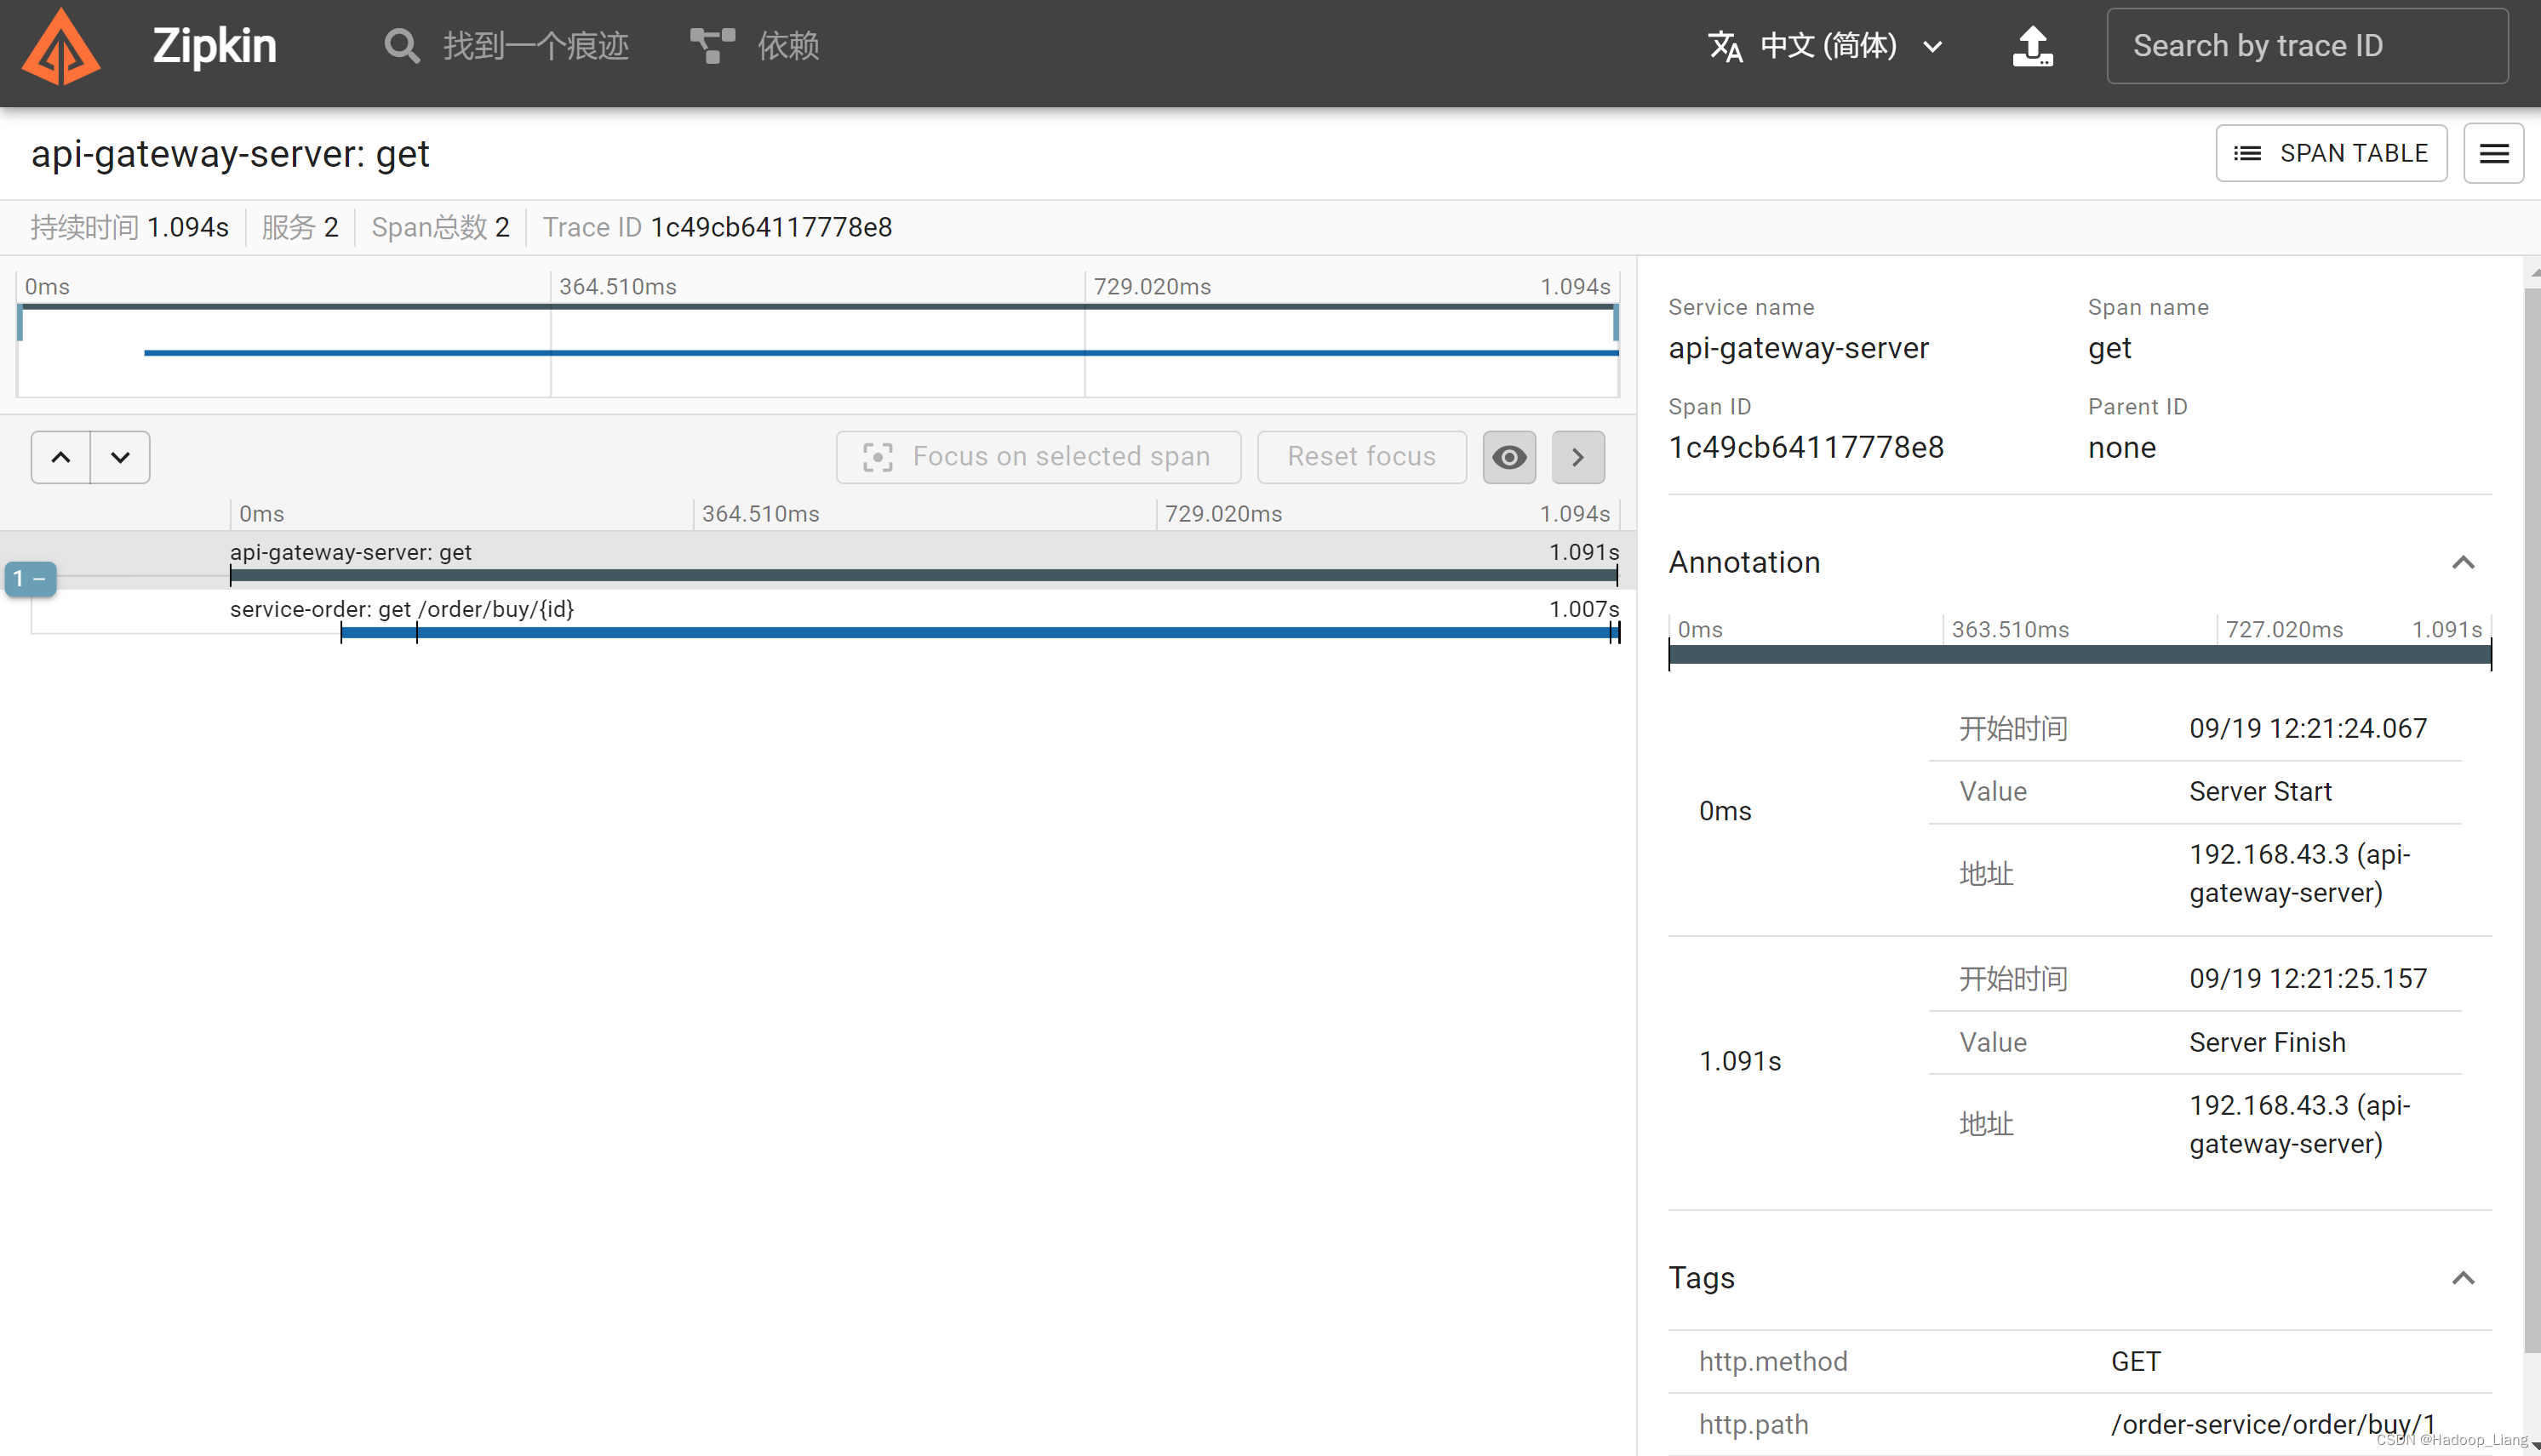
查看调用详情,点击右边的SHOW,看到如下界面
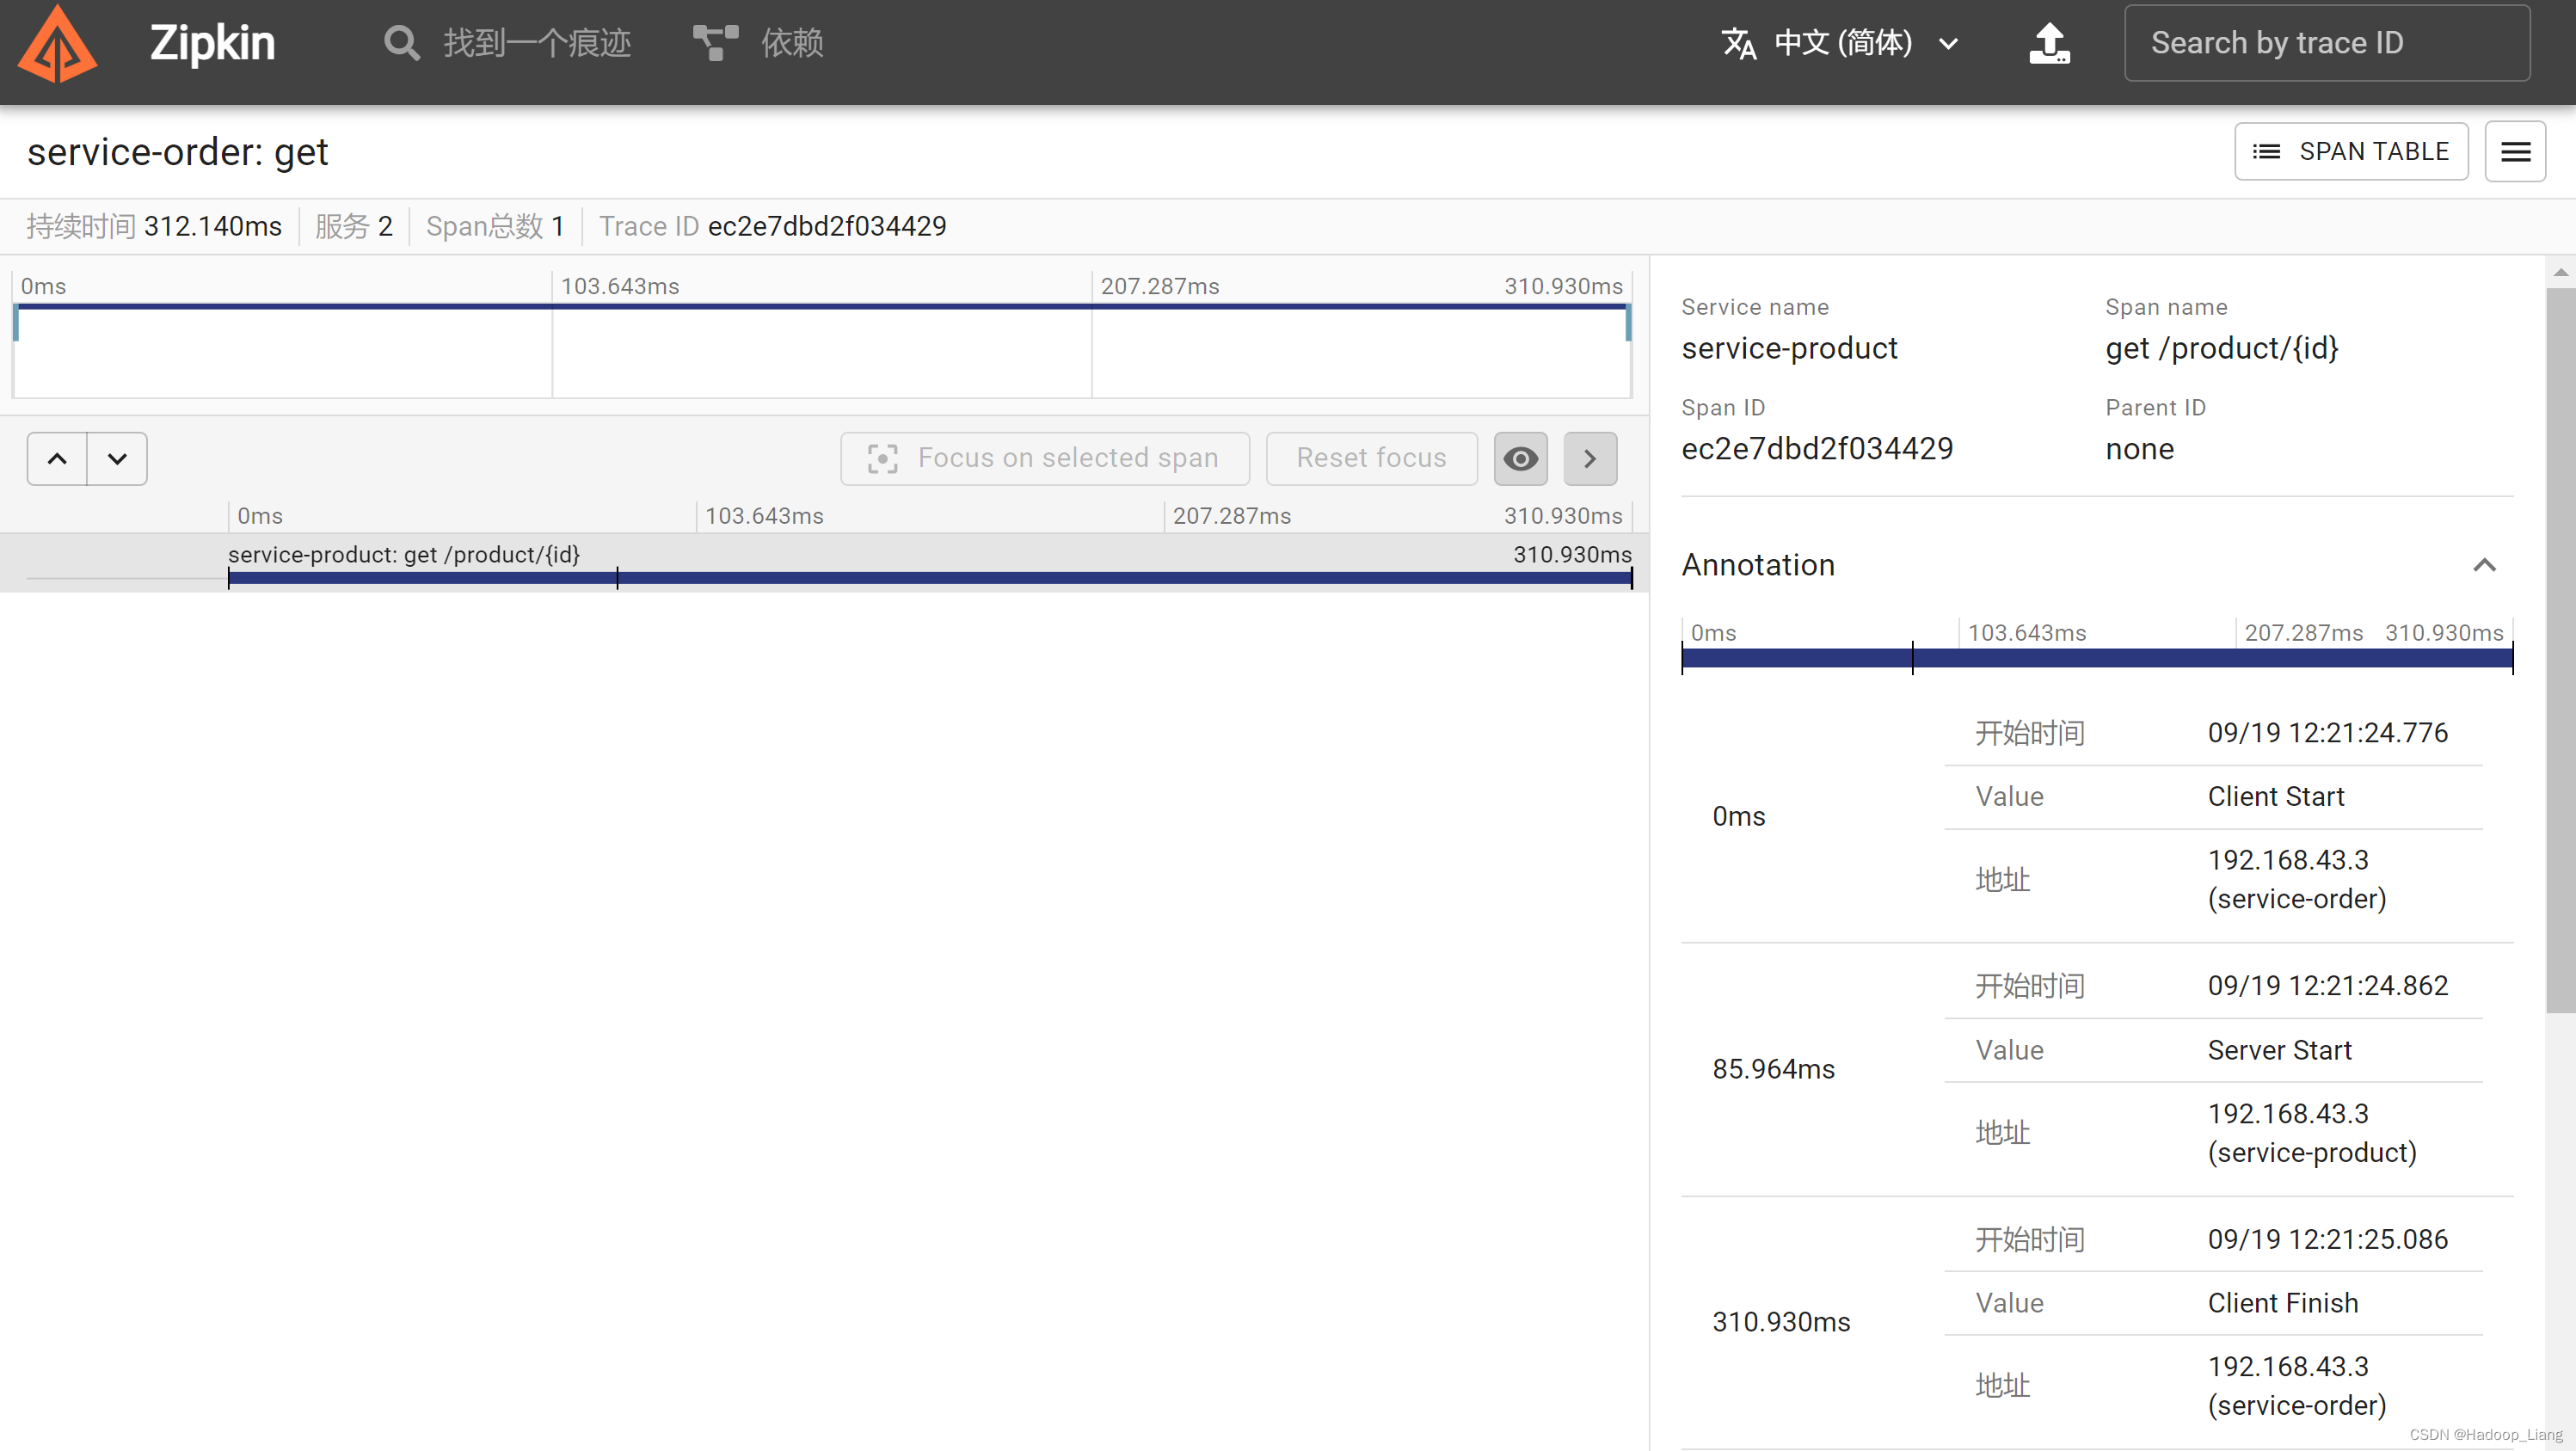
可以看到api-gateway-server网关服务调用了service-order订单服务 查看service-order订单服务详情,看到订单服务调用了service-product订单服务。
调用链路问题: 保存在内存中,不能够持久化(重启zipkin server,调用链路数据丢失) http请求,请求多时服务器响应不过来会有数据丢失可能,如何保证数据可靠性 链路数据持久化为了重启zipkin server调用链路数据不丢失,可以使用mysql将调用链路数据持久化。 在mysql中,创建数据库 create database zipkin;查看官方文档,得知sql脚本如下 -- -- Copyright 2015-2019 The OpenZipkin Authors -- -- Licensed under the Apache License, Version 2.0 (the "License"); you may not use this file except -- in compliance with the License. You may obtain a copy of the License at -- -- http://www.apache.org/licenses/LICENSE-2.0 -- -- Unless required by applicable law or agreed to in writing, software distributed under the License -- is distributed on an "AS IS" BASIS, WITHOUT WARRANTIES OR CONDITIONS OF ANY KIND, either express -- or implied. See the License for the specific language governing permissions and limitations under -- the License. -- CREATE TABLE IF NOT EXISTS zipkin_spans ( `trace_id_high` BIGINT NOT NULL DEFAULT 0 COMMENT 'If non zero, this means the trace uses 128 bit traceIds instead of 64 bit', `trace_id` BIGINT NOT NULL, `id` BIGINT NOT NULL, `name` VARCHAR(255) NOT NULL, `remote_service_name` VARCHAR(255), `parent_id` BIGINT, `debug` BIT(1), `start_ts` BIGINT COMMENT 'Span.timestamp(): epoch micros used for endTs query and to implement TTL', `duration` BIGINT COMMENT 'Span.duration(): micros used for minDuration and maxDuration query', PRIMARY KEY (`trace_id_high`, `trace_id`, `id`) ) ENGINE=InnoDB ROW_FORMAT=COMPRESSED CHARACTER SET=utf8 COLLATE utf8_general_ci; ALTER TABLE zipkin_spans ADD INDEX(`trace_id_high`, `trace_id`) COMMENT 'for getTracesByIds'; ALTER TABLE zipkin_spans ADD INDEX(`name`) COMMENT 'for getTraces and getSpanNames'; ALTER TABLE zipkin_spans ADD INDEX(`remote_service_name`) COMMENT 'for getTraces and getRemoteServiceNames'; ALTER TABLE zipkin_spans ADD INDEX(`start_ts`) COMMENT 'for getTraces ordering and range'; CREATE TABLE IF NOT EXISTS zipkin_annotations ( `trace_id_high` BIGINT NOT NULL DEFAULT 0 COMMENT 'If non zero, this means the trace uses 128 bit traceIds instead of 64 bit', `trace_id` BIGINT NOT NULL COMMENT 'coincides with zipkin_spans.trace_id', `span_id` BIGINT NOT NULL COMMENT 'coincides with zipkin_spans.id', `a_key` VARCHAR(255) NOT NULL COMMENT 'BinaryAnnotation.key or Annotation.value if type == -1', `a_value` BLOB COMMENT 'BinaryAnnotation.value(), which must be smaller than 64KB', `a_type` INT NOT NULL COMMENT 'BinaryAnnotation.type() or -1 if Annotation', `a_timestamp` BIGINT COMMENT 'Used to implement TTL; Annotation.timestamp or zipkin_spans.timestamp', `endpoint_ipv4` INT COMMENT 'Null when Binary/Annotation.endpoint is null', `endpoint_ipv6` BINARY(16) COMMENT 'Null when Binary/Annotation.endpoint is null, or no IPv6 address', `endpoint_port` SMALLINT COMMENT 'Null when Binary/Annotation.endpoint is null', `endpoint_service_name` VARCHAR(255) COMMENT 'Null when Binary/Annotation.endpoint is null' ) ENGINE=InnoDB ROW_FORMAT=COMPRESSED CHARACTER SET=utf8 COLLATE utf8_general_ci; ALTER TABLE zipkin_annotations ADD UNIQUE KEY(`trace_id_high`, `trace_id`, `span_id`, `a_key`, `a_timestamp`) COMMENT 'Ignore insert on duplicate'; ALTER TABLE zipkin_annotations ADD INDEX(`trace_id_high`, `trace_id`, `span_id`) COMMENT 'for joining with zipkin_spans'; ALTER TABLE zipkin_annotations ADD INDEX(`trace_id_high`, `trace_id`) COMMENT 'for getTraces/ByIds'; ALTER TABLE zipkin_annotations ADD INDEX(`endpoint_service_name`) COMMENT 'for getTraces and getServiceNames'; ALTER TABLE zipkin_annotations ADD INDEX(`a_type`) COMMENT 'for getTraces and autocomplete values'; ALTER TABLE zipkin_annotations ADD INDEX(`a_key`) COMMENT 'for getTraces and autocomplete values'; ALTER TABLE zipkin_annotations ADD INDEX(`trace_id`, `span_id`, `a_key`) COMMENT 'for dependencies job'; CREATE TABLE IF NOT EXISTS zipkin_dependencies ( `day` DATE NOT NULL, `parent` VARCHAR(255) NOT NULL, `child` VARCHAR(255) NOT NULL, `call_count` BIGINT, `error_count` BIGINT, PRIMARY KEY (`day`, `parent`, `child`) ) ENGINE=InnoDB ROW_FORMAT=COMPRESSED CHARACTER SET=utf8 COLLATE utf8_general_ci;在zipkin数据库中执行以上sql语句,得到三张空表
zipkin启动时,配置数据库项 查看官网,zipkin配置示例如下: zipkin: self-tracing: # Set to true to enable self-tracing. enabled: ${SELF_TRACING_ENABLED:false} # percentage of self-traces to retain. If set to a value other than 1.0, traces-per-second will # not be used. sample-rate: ${SELF_TRACING_SAMPLE_RATE:1.0} # Number of traces per second to retain. sample-rate must be set to 1.0 to use this value. If # set to 0, an unlimited number of traces per second will be retained. traces-per-second: ${SELF_TRACING_TRACES_PER_SECOND:1} # Timeout in seconds to flush self-tracing data to storage. message-timeout: ${SELF_TRACING_FLUSH_INTERVAL:1} collector: # percentage to traces to retain sample-rate: ${COLLECTOR_SAMPLE_RATE:1.0} activemq: enabled: ${COLLECTOR_ACTIVEMQ_ENABLED:true} # ActiveMQ broker url. Ex. tcp://localhost:61616 or failover:(tcp://localhost:61616,tcp://remotehost:61616) url: ${ACTIVEMQ_URL:} # Queue from which to collect span messages. queue: ${ACTIVEMQ_QUEUE:zipkin} # Number of concurrent span consumers. concurrency: ${ACTIVEMQ_CONCURRENCY:1} # Optional username to connect to the broker username: ${ACTIVEMQ_USERNAME:} # Optional password to connect to the broker password: ${ACTIVEMQ_PASSWORD:} http: # Set to false to disable creation of spans via HTTP collector API enabled: ${COLLECTOR_HTTP_ENABLED:${HTTP_COLLECTOR_ENABLED:true}} grpc: # Set to true to enable the GRPC collector enabled: ${COLLECTOR_GRPC_ENABLED:false} kafka: enabled: ${COLLECTOR_KAFKA_ENABLED:true} # Kafka bootstrap broker list, comma-separated host:port values. Setting this activates the # Kafka 0.10+ collector. bootstrap-servers: ${KAFKA_BOOTSTRAP_SERVERS:} # Name of topic to poll for spans topic: ${KAFKA_TOPIC:zipkin} # Consumer group this process is consuming on behalf of. group-id: ${KAFKA_GROUP_ID:zipkin} # Count of consumer threads consuming the topic streams: ${KAFKA_STREAMS:1} rabbitmq: enabled: ${COLLECTOR_RABBITMQ_ENABLED:true} # RabbitMQ server address list (comma-separated list of host:port) addresses: ${RABBIT_ADDRESSES:} concurrency: ${RABBIT_CONCURRENCY:1} # TCP connection timeout in milliseconds connection-timeout: ${RABBIT_CONNECTION_TIMEOUT:60000} password: ${RABBIT_PASSWORD:guest} queue: ${RABBIT_QUEUE:zipkin} username: ${RABBIT_USER:guest} virtual-host: ${RABBIT_VIRTUAL_HOST:/} useSsl: ${RABBIT_USE_SSL:false} uri: ${RABBIT_URI:} scribe: enabled: ${COLLECTOR_SCRIBE_ENABLED:${SCRIBE_ENABLED:false}} category: ${SCRIBE_CATEGORY:zipkin} port: ${COLLECTOR_PORT:9410} query: enabled: ${QUERY_ENABLED:true} # Timeout for requests to the query API timeout: ${QUERY_TIMEOUT:11s} # 1 day in millis lookback: ${QUERY_LOOKBACK:86400000} # The Cache-Control max-age (seconds) for /api/v2/services, /api/v2/remoteServices and /api/v2/spans names-max-age: 300 # CORS allowed-origins. allowed-origins: "*" # Internal properties that end users should never try to use internal: actuator: enabled: true # auto-configuration to include when ArmeriaSpringActuatorAutoConfiguration is present. # Note: These are still subject to endpoint conditions. The list must be checked for drift # upgrading Spring Boot. include: - org.springframework.boot.actuate.autoconfigure.beans.BeansEndpointAutoConfiguration - org.springframework.boot.actuate.autoconfigure.condition.ConditionsReportEndpointAutoConfiguration - org.springframework.boot.actuate.autoconfigure.context.properties.ConfigurationPropertiesReportEndpointAutoConfiguration - org.springframework.boot.actuate.autoconfigure.endpoint.EndpointAutoConfiguration - org.springframework.boot.actuate.autoconfigure.env.EnvironmentEndpointAutoConfiguration - org.springframework.boot.actuate.autoconfigure.management.HeapDumpWebEndpointAutoConfiguration - org.springframework.boot.actuate.autoconfigure.logging.LoggersEndpointAutoConfiguration - org.springframework.boot.actuate.autoconfigure.management.ThreadDumpEndpointAutoConfiguration storage: strict-trace-id: ${STRICT_TRACE_ID:true} search-enabled: ${SEARCH_ENABLED:true} autocomplete-keys: ${AUTOCOMPLETE_KEYS:} autocomplete-ttl: ${AUTOCOMPLETE_TTL:3600000} autocomplete-cardinality: 20000 type: ${STORAGE_TYPE:mem} throttle: enabled: ${STORAGE_THROTTLE_ENABLED:false} min-concurrency: ${STORAGE_THROTTLE_MIN_CONCURRENCY:10} max-concurrency: ${STORAGE_THROTTLE_MAX_CONCURRENCY:200} max-queue-size: ${STORAGE_THROTTLE_MAX_QUEUE_SIZE:1000} mem: # Maximum number of spans to keep in memory. When exceeded, oldest traces (and their spans) will be purged. max-spans: ${MEM_MAX_SPANS:500000} cassandra: # Comma separated list of host addresses part of Cassandra cluster. Ports default to 9042 but you can also specify a custom port with 'host:port'. contact-points: ${CASSANDRA_CONTACT_POINTS:localhost} # Name of the datacenter that will be considered "local" for load balancing. local-dc: ${CASSANDRA_LOCAL_DC:datacenter1} # Will throw an exception on startup if authentication fails. username: ${CASSANDRA_USERNAME:} password: ${CASSANDRA_PASSWORD:} keyspace: ${CASSANDRA_KEYSPACE:zipkin} # Max pooled connections per datacenter-local host. max-connections: ${CASSANDRA_MAX_CONNECTIONS:8} # Ensuring that schema exists, if enabled tries to execute script /zipkin-cassandra-core/resources/cassandra-schema.cql. ensure-schema: ${CASSANDRA_ENSURE_SCHEMA:true} # 7 days in seconds span-ttl: ${CASSANDRA_SPAN_TTL:604800} # 3 days in seconds index-ttl: ${CASSANDRA_INDEX_TTL:259200} # the maximum trace index metadata entries to cache index-cache-max: ${CASSANDRA_INDEX_CACHE_MAX:100000} # how long to cache index metadata about a trace. 1 minute in seconds index-cache-ttl: ${CASSANDRA_INDEX_CACHE_TTL:60} # how many more index rows to fetch than the user-supplied query limit index-fetch-multiplier: ${CASSANDRA_INDEX_FETCH_MULTIPLIER:3} # Using ssl for connection, rely on Keystore use-ssl: ${CASSANDRA_USE_SSL:false} cassandra3: # Comma separated list of host addresses part of Cassandra cluster. Ports default to 9042 but you can also specify a custom port with 'host:port'. contact-points: ${CASSANDRA_CONTACT_POINTS:localhost} # Name of the datacenter that will be considered "local" for load balancing. local-dc: ${CASSANDRA_LOCAL_DC:datacenter1} # Will throw an exception on startup if authentication fails. username: ${CASSANDRA_USERNAME:} password: ${CASSANDRA_PASSWORD:} keyspace: ${CASSANDRA_KEYSPACE:zipkin2} # Max pooled connections per datacenter-local host. max-connections: ${CASSANDRA_MAX_CONNECTIONS:8} # Ensuring that schema exists, if enabled tries to execute script /zipkin2-schema.cql ensure-schema: ${CASSANDRA_ENSURE_SCHEMA:true} # how many more index rows to fetch than the user-supplied query limit index-fetch-multiplier: ${CASSANDRA_INDEX_FETCH_MULTIPLIER:3} # Using ssl for connection, rely on Keystore use-ssl: ${CASSANDRA_USE_SSL:false} elasticsearch: # host is left unset intentionally, to defer the decision hosts: ${ES_HOSTS:} pipeline: ${ES_PIPELINE:} timeout: ${ES_TIMEOUT:10000} index: ${ES_INDEX:zipkin} ensure-templates: ${ES_ENSURE_TEMPLATES:true} date-separator: ${ES_DATE_SEPARATOR:-} index-shards: ${ES_INDEX_SHARDS:5} index-replicas: ${ES_INDEX_REPLICAS:1} username: ${ES_USERNAME:} password: ${ES_PASSWORD:} credentials-file: ${ES_CREDENTIALS_FILE:} credentials-refresh-interval: ${ES_CREDENTIALS_REFRESH_INTERVAL:5} http-logging: ${ES_HTTP_LOGGING:} ssl: no-verify: ${ES_SSL_NO_VERIFY:false} health-check: enabled: ${ES_HEALTH_CHECK_ENABLED:true} interval: ${ES_HEALTH_CHECK_INTERVAL:3s} template-priority: ${ES_TEMPLATE_PRIORITY:} mysql: jdbc-url: ${MYSQL_JDBC_URL:} host: ${MYSQL_HOST:localhost} port: ${MYSQL_TCP_PORT:3306} username: ${MYSQL_USER:} password: ${MYSQL_PASS:} db: ${MYSQL_DB:zipkin} max-active: ${MYSQL_MAX_CONNECTIONS:10} use-ssl: ${MYSQL_USE_SSL:false} ui: enabled: ${QUERY_ENABLED:true} ## Values below here are mapped to ZipkinUiProperties, served as /config.json # Default limit for Find Traces query-limit: 10 # The value here becomes a label in the top-right corner environment: # Default duration to look back when finding traces. # Affects the "Start time" element in the UI. 15 minutes in millis default-lookback: 900000 # When false, disables the "Discover" screen search-enabled: ${SEARCH_ENABLED:true} # Which sites this Zipkin UI covers. Regex syntax. (e.g. http:\/\/example.com\/.*) # Multiple sites can be specified, e.g. # - .*example1.com # - .*example2.com # Default is "match all websites" instrumented: .* # URL placed into the tag in the HTML base-path: /zipkin # We are using Armeria instead of Tomcat. Have it inherit the default configuration from Spring spring.main.web-application-type: none # These defaults are not used directly. They are used via armeria namespacing server: port: ${QUERY_PORT:9411} use-forward-headers: true compression: enabled: true # compresses any response over min-response-size (default is 2KiB) # Includes dynamic json content and large static assets from zipkin-ui mime-types: application/json,application/javascript,text/css,image/svg min-response-size: 2048 armeria: ports: - port: ${server.port} protocols: - http compression: enabled: ${server.compression.enabled} mime-types: ${server.compression.mime-types} min-response-size: ${server.compression.min-response-size} gracefulShutdownQuietPeriodMillis: -1 gracefulShutdownTimeoutMillis: -1 spring: jmx: # reduce startup time by excluding unexposed JMX service enabled: false mvc: favicon: # zipkin has its own favicon enabled: false autoconfigure: # NOTE: These exclusions can drift between Spring Boot minor versions. Audit accordingly. # Ex. curl -s localhost:9411/actuator/beans|jq '.contexts.application.beans|keys_unsorted[]'|sort exclude: # JMX is disabled - org.springframework.boot.actuate.autoconfigure.endpoint.jmx.JmxEndpointAutoConfiguration # /health and /actuator/health served directly by Armeria - org.springframework.boot.actuate.autoconfigure.health.HealthEndpointAutoConfiguration - org.springframework.boot.actuate.autoconfigure.health.HealthContributorAutoConfiguration # /info and /actuator/info served directly by Armeria (content is /info.json) - org.springframework.boot.autoconfigure.info.ProjectInfoAutoConfiguration - org.springframework.boot.actuate.autoconfigure.info.InfoContributorAutoConfiguration # /prometheus and /actuator/prometheus are served directly by Armeria - org.springframework.boot.actuate.autoconfigure.metrics.export.prometheus.PrometheusMetricsExportAutoConfiguration # Remove unused auto-configuration - org.springframework.boot.autoconfigure.cassandra.CassandraAutoConfiguration - org.springframework.boot.autoconfigure.jackson.JacksonAutoConfiguration - org.springframework.boot.autoconfigure.jdbc.DataSourceAutoConfiguration - org.springframework.boot.autoconfigure.jooq.JooqAutoConfiguration - org.springframework.boot.autoconfigure.jms.activemq.ActiveMQAutoConfiguration - org.springframework.boot.autoconfigure.task.TaskExecutionAutoConfiguration - org.springframework.boot.autoconfigure.task.TaskSchedulingAutoConfiguration logging: pattern: level: "%clr{%5p} %clr{[%X{traceId}/%X{spanId}]}{yellow}" level: # Hush MySQL related logs org.springframework.scheduling.concurrent.ThreadPoolTaskExecutor: 'WARN' com.zaxxer.hikari.HikariDataSource: 'WARN' # Don't print driver version in console output com.datastax.oss.driver.internal.core.DefaultMavenCoordinates: 'WARN' # We exclude Geo codec and Graph extensions to keep size down com.datastax.oss.driver.internal.core.context.InternalDriverContext: 'WARN' # Use of native clocks in Cassandra is not insightful com.datastax.oss.driver.internal.core.time.Clock: 'WARN' # Unless it's serious we don't want to know com.linecorp.armeria: 'WARN' # # But allow to say it's ready to serve requests com.linecorp.armeria.server.Server: 'INFO' # kafka is quite chatty so we switch everything off by default org.apache.kafka: 'OFF' # # investigate /api/v2/dependencies # zipkin2.internal.DependencyLinker: 'DEBUG' # # log reason behind http collector dropped messages # zipkin2.server.ZipkinHttpCollector: 'DEBUG' # zipkin2.collector.kafka.KafkaCollector: 'DEBUG' # zipkin2.collector.rabbitmq.RabbitMQCollector: 'DEBUG' # zipkin2.collector.scribe.ScribeCollector: 'DEBUG' management: endpoints: web: exposure: include: '*' # Below are served directly without actuator. endpoint: health: enabled: false prometheus: enabled: false info: enabled: false # Disabling auto time http requests since it is added in ZipkinPrometheusMetricsConfiguration # In Zipkin we use different naming for the http requests duration metrics: web: server: auto-time-requests: falsecmd进入zipkin所在目录,执行如下命令,启动zipkin服务端 java -jar zipkin-server-2.24.3-exec.jar --STORAGE_TYPE=mysql --MYSQL_HOST=127.0.0.1 --MYSQL_TCP_PORT=3306 --MYSQL_USER=root --MYSQL_PASS=123 --MYSQL_DB=zipkin浏览器访问 启动eureka、gateway、product、order服务 测试 浏览器访问 http://localhost:8080/order-service/order/buy/1 响应 {"id":1,"productName":"访问的服务地址:192.168.43.3:9001","status":1,"price":3000.00,"productDesc":"abc","caption":"haha","inventory":100} 返回浏览器查看zipkin界面
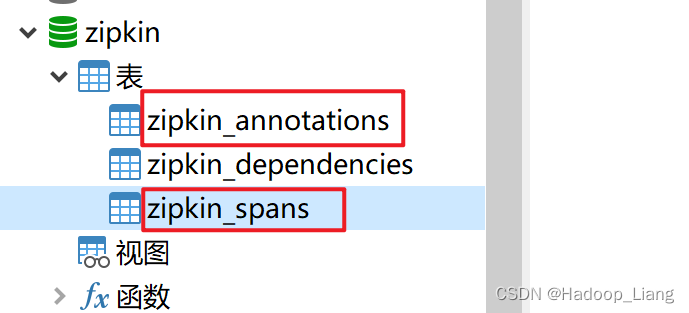
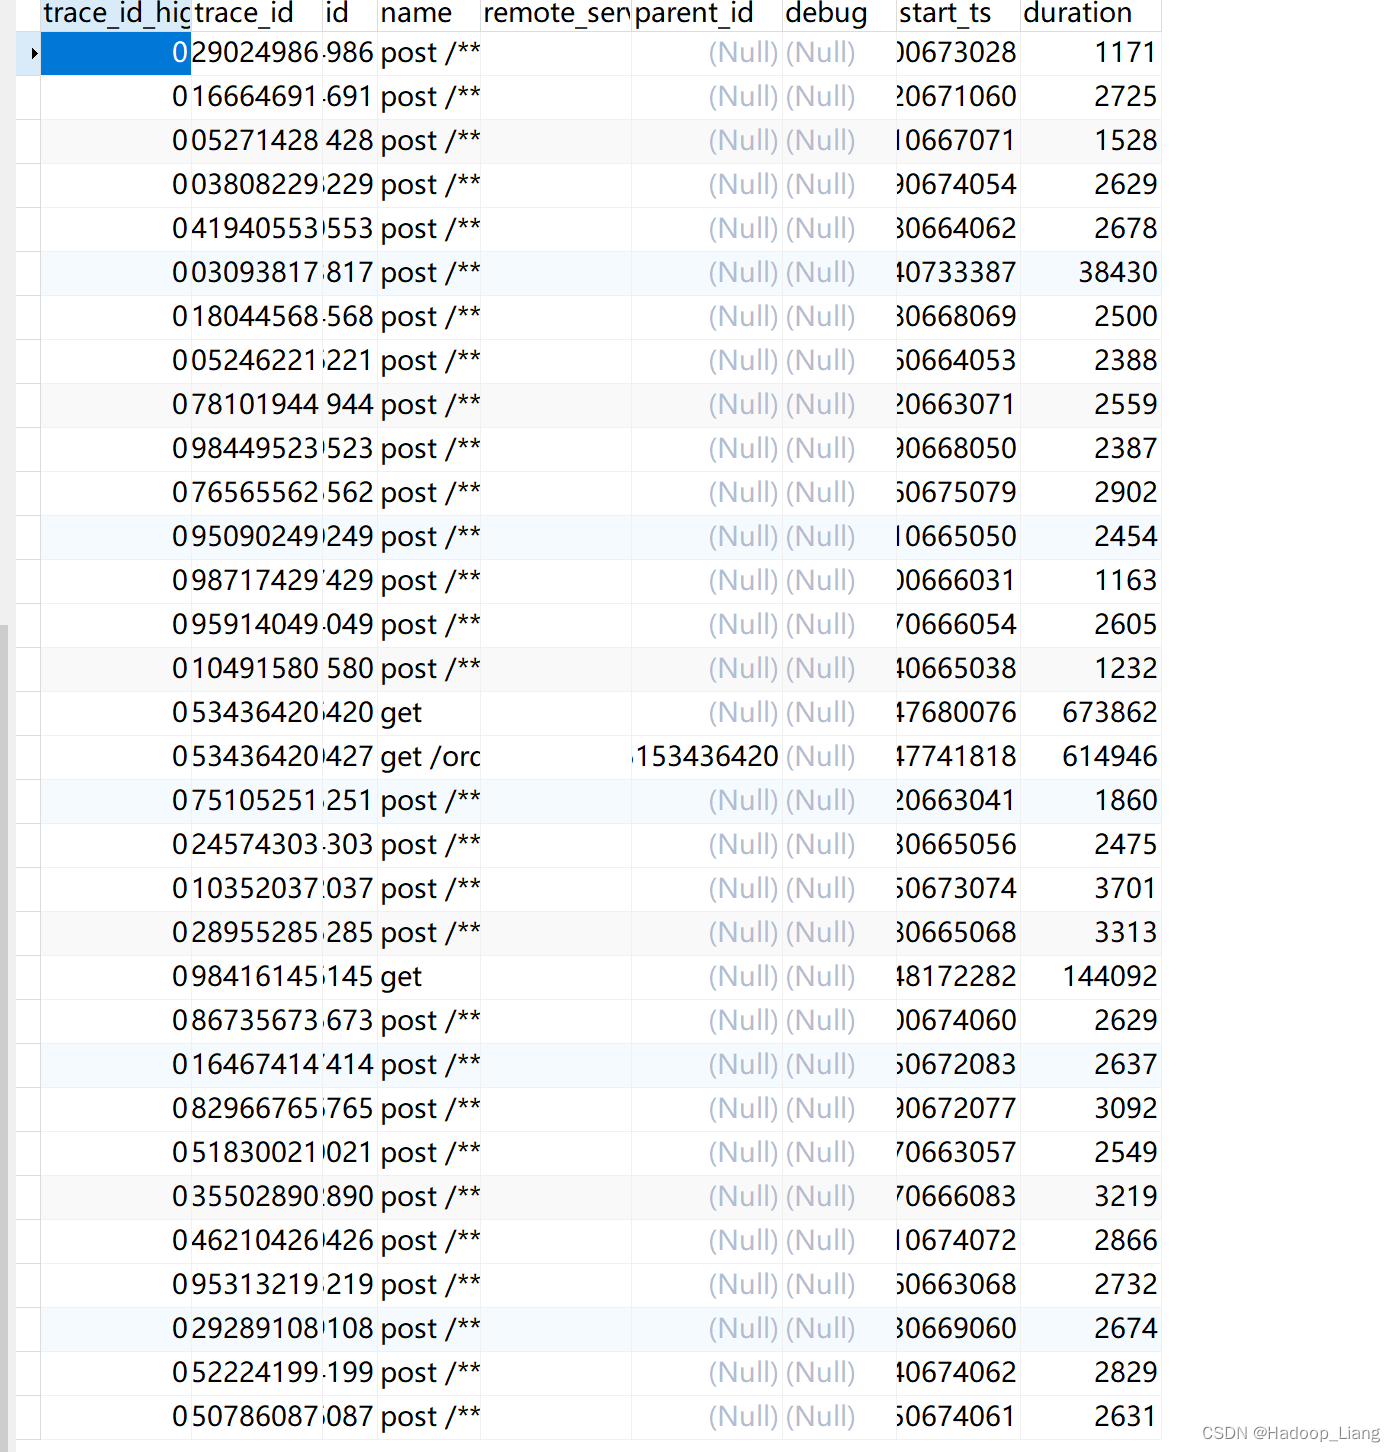
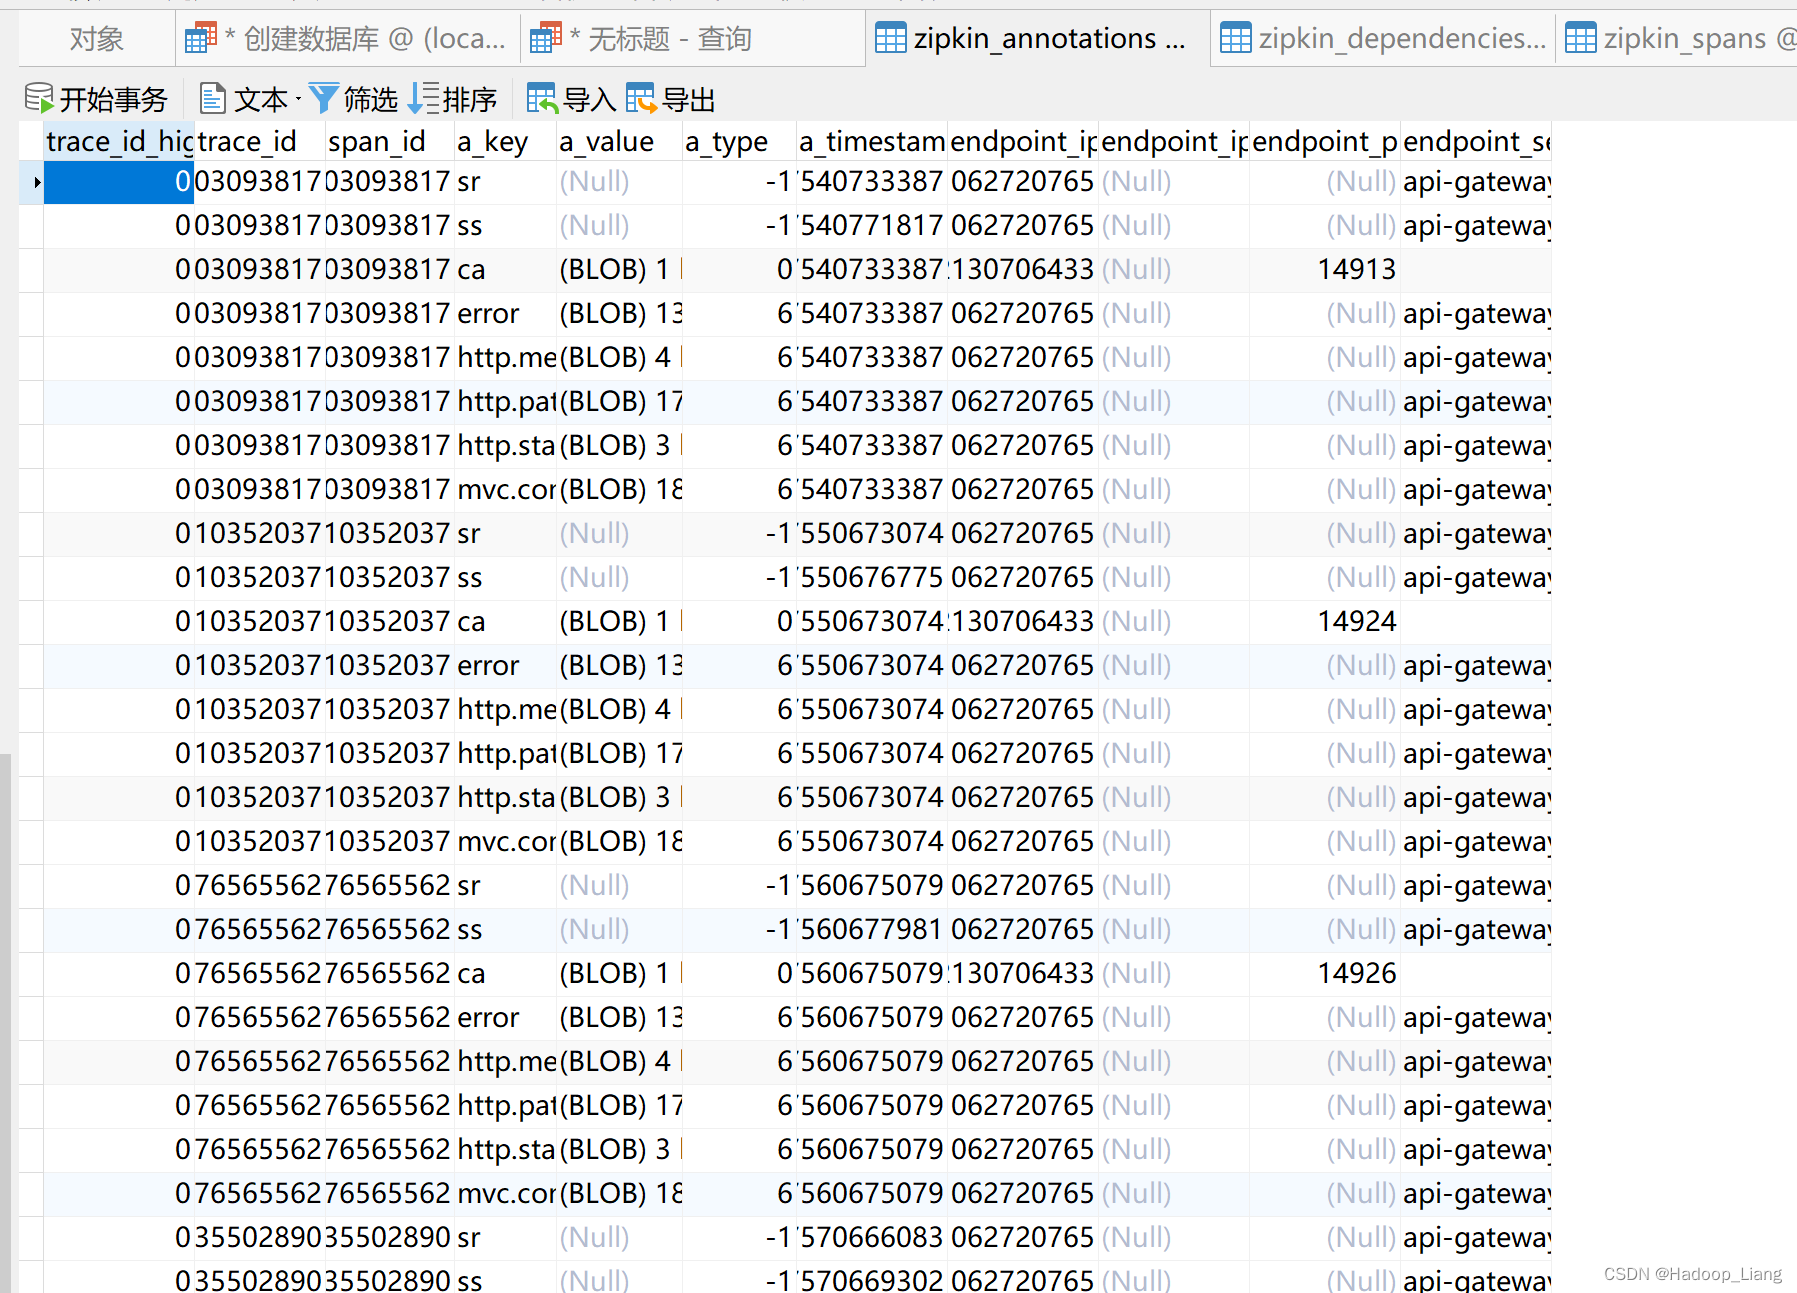
刷新数据表,查看到spans和annotations表有数据
停止zipkin服务 重新命令行开启zipkin服务 再次访问zipkin页面,还能看到之前请求的数据
总结: 创建数据库和数据表 zipkin启动时,配置数据库项 RabbitMQ请求为了应对zipkin客户端请求过多时,zipkin服务端信息收集不及时问题。可以在zipkin客户端和zipkin服务端之间添加消息中间件来收集信息。这里的中间件使用RabbitMQ。
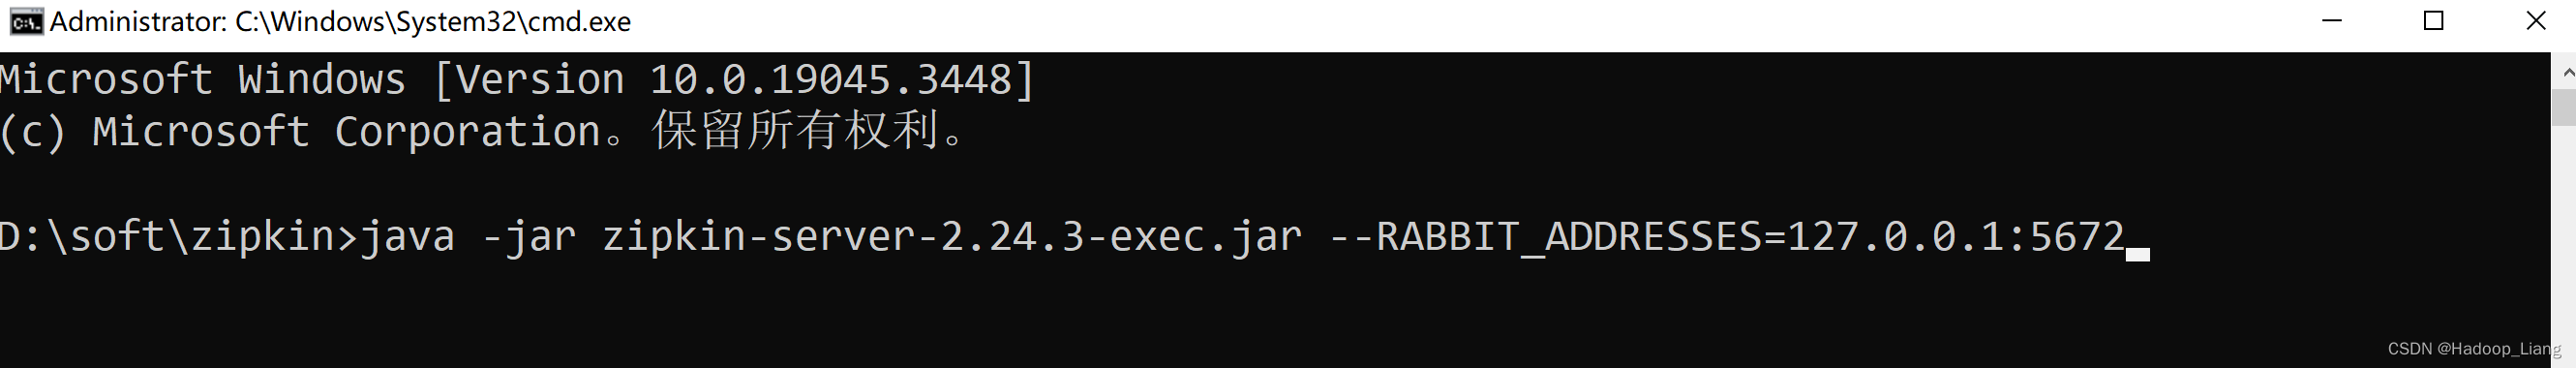
使用RebbitMQ进行异步收集 1. 安装RabbitMQ可参考:Windows下安装RabbitMQ 2. 启动zipkin服务端,配置从rabbit中拉取消息 java -jar zipkin-server-2.24.3-exec.jar --RABBIT_ADDRESSES=127.0.0.1:5672
分别在gateway、product、order服务,添加如下依赖 org.springframework.amqp spring-rabbit分别修改gateway、product、order服务的配置文件application.yml,修改zipkin的sender type为rabbit,添加rabbitmq配置 spring: base-url: http://127.0.0.1:9411/ zipkin: sender: type: rabbit #数据的传输方式,以rabbit的方式向server端发送数据 sleuth: sampler: probability: 1 #采样比,日志的采样比例,默认0.1,测试环境设置为100%收集日志 rabbitmq: host: localhost port: 5672 username: guest password: guest listener: #这里配置重试策略 direct: retry: enabled: true simple: retry: enabled: true重启gateway、order、product服务 停止zipkin服务,然后访问多次微服务,看信息是否能来到rabbitmq中间件 http://localhost:8080/order-service/order/buy/1 http://localhost:8080/product-service/product/1 浏览器刷新rabbitmq web页面http://localhost:15672/,看到了消息队列里有name为zipkin的消息
重新启动zipkin服务 java -jar zipkin-server-2.24.3-exec.jar --RABBIT_ADDRESSES=127.0.0.1:5672zipkin依然能看到刚才的访问
说明RabbitMQ可以实现zipkin客户端和zipkin服务端的解耦,确保zipkin客户端请求调用链路数据不丢失。 完成!enjoy it! |
 这里先不保存到数据库,重点关注从rabbitmq拿到信息。
【本文地址】
今日新闻 |
推荐新闻 |